Debugging made easy with AI
Designed AI-assisted debugging workflows for Android internal tools, helping developers interpret logs, understand failures, and reduce time spent on manual root cause analysis.
As a UX Designer embedded within Android UX, I led the design of machine learning–powered debugging experiences that surface relevant signals, explain system behavior in developer-friendly language, and integrate AI assistance directly into existing workflows. The work focused on improving developer trust and productivity through context-aware explanations, progressive disclosure, and feedback loops.
This effort advanced how AI supports developer reasoning in complex systems—augmenting debugging workflows without replacing developer control.
Debugging Behavior Design :
My Role
UX Designer - Remote
Timeframe: 5 months
Our Team
Design Manager/ Design Team
AI/ML Engineers
Android Developers
UX Researchers
Product Managers
My Deliverables
- UX Strategy - Defined the end-to-end UX strategy for integrating AI assistant and log explanation in ABT
- Interaction Design- Micro-interactions (Highlight Relevant Logs), Macro-interactions (Explain Logs)
- Prototypes-End-to-end ABT AI prototype for UXR (Log Highlight, Explain, Chatbot Integration)
- UI Design-Visual UI specs for log banners, feedback UI, Duckie chatbot redesign
- Research Collaboration - Defined UXR test scenarios, synthesizing prompt rankings & confidence insights
- AI Prompt Design- Designed AI prompting flows for log explanations & Buganizer context injection
- Iterative Testing & Feedback Loops - Conducted design validations with SysUI & Modem teams, implemented quick fixes for Buganizer tool
This case study contains my own views and does not reflect the views of the organisation. Screens and descriptions are reconstructed or anonymized representations of internal tools designed under NDA. Details are illustrative and do not reflect production systems.
Project Overview
The Android Bug Tool (ABT) is the primary log viewer and analysis tool used by Android engineers to triage and diagnose bugs in the Android OS. Bugs are filed, discussed, and tracked in Buganizer, which manages ownership, priority, and lifecycle. When engineers need to understand what actually happened, they move from Buganizer into ABT, where they inspect system logs, analyze failure signals, and investigate root causes.
Buganizer manages the bug, and ABT is where debugging begins.
This project focused on improving how developers use ABT during initial bug triage and investigation, by integrating AI-assisted capabilities directly into the debugging flow—helping engineers move from raw logs to understanding more quickly, without disrupting existing workflows or developer control.
Problem & Context
Debugging is a foundational workflow for Android engineering. At Google scale, even small inefficiencies compound across thousands of engineers and millions of bugs, directly impacting development velocity and platform reliability. Android developers—particularly those responsible for initial bug triage and investigation—often need to parse through hundreds of thousands to millions of log lines and manually correlate information across logs, source code, and bug reports. During early triage, engineers frequently spend multiple hours just determining where to start, making this phase the most time-consuming and uncertain part of debugging.
Users Impacted
This problem primarily affected developers working closest to system failures:
Primary Users — Android Engineers (Bug Triagers & Investigators)
- Responsible for initial bug triage and root-cause analysis
- Work directly with large, noisy log files in ABT
- Highly sensitive to AI accuracy, explainability, and control
Secondary Users — QA and On-Call Engineers
- Validate issues or triage bugs under time pressure
- Need fast signal detection and clear system explanations
- For these users, early triage is where the most time and uncertainty accumulate, making it the highest-leverage moment to improve the debugging experience.
User Pain points
Android developers faced significant friction during initial bug triage and investigation, driven by the lack of contextual intelligence in existing tools.
Key pain points included:
- High cognitive load and log overload: Developers spent hours scanning verbose, unstructured logs, mentally filtering signal from noise during early triage.
- Manual and fragmented workflows: Understanding a bug required jumping between ABT, Buganizer, and source code, with little system support for correlation.
- Limited trust in existing AI assistance: The existing AI assistant (Duckie) lacked Android-specific grounding and produced generic responses, reducing confidence and adoption.
- Lack of confidence-building UI patterns: AI surfaced information without clearly explaining why it was relevant, making it difficult for developers to verify or rely on suggestions.
Product Gaps
Traditional debugging tools lacked the contextual intelligence needed to support modern Android debugging at scale.
Key gaps included:
- No support for identifying relevance early: Logs were presented as raw output, offering little guidance on which signals mattered most during triage.
- Limited connection between logs, bugs, and system context: Developers had to manually correlate information across tools and artifacts.
- AI assistance disconnected from core workflows: Duckie operated largely outside of ABT, breaking flow and limiting usefulness during active debugging.
- Insufficient trust and verification mechanisms: AI output lacked transparency, feedback loops, and visible confidence cues.
Solution - AI Log assistance
I designed a layered, AI-assisted debugging experience embedded directly into ABT, focused on supporting developers during triage and investigation.
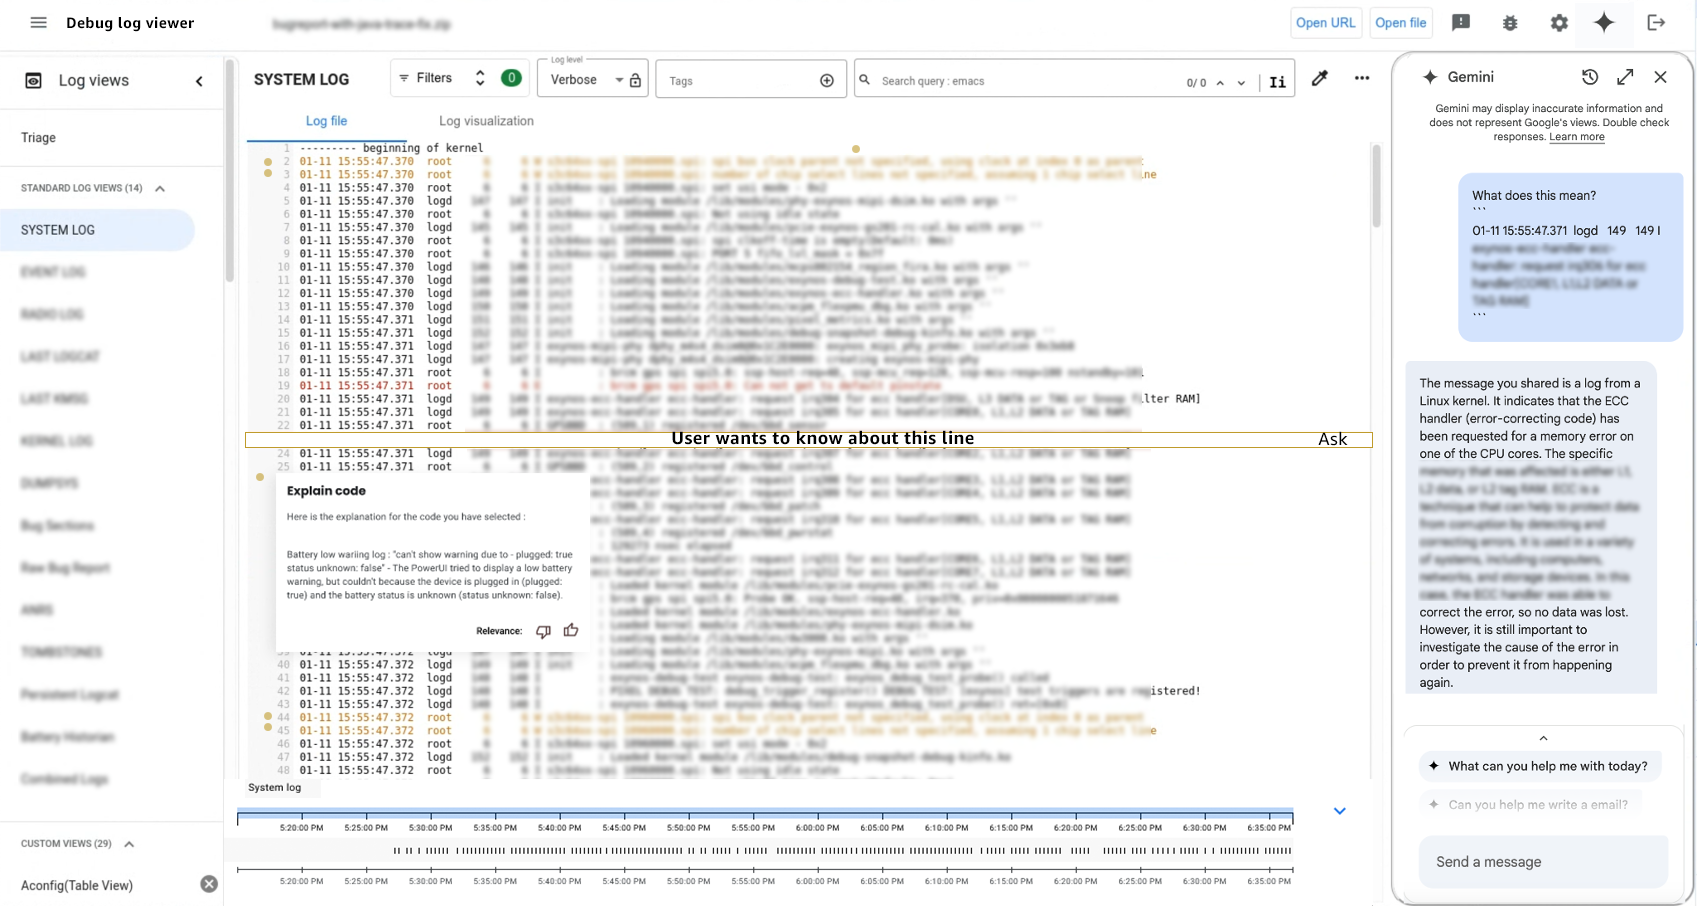
The solution introduced AI at key moments in the debugging workflow, aligned to real developer needs:
- Identify relevant log signals early : AI highlights likely relevant log lines and clusters directly within the log viewer, helping developers quickly focus on where to begin instead of scanning entire log files.
- Support understanding through visualization: Log visualization and temporal interactions make it easier to reason about when events occurred, how failures unfolded, and what changed leading up to an issue.
- Explain system behavior at multiple depths
Developers can access:- Inline, contextual explanations for quick clarification without breaking flow
- Conversational AI explanations for deeper investigation and follow-up questions
- Preserve developer trust and control: All AI interventions are visible, inspectable, and optional, with feedback loops that allow developers to verify, refine, or challenge AI output.
In this model, AI acts as a co-pilot—not an authority—helping developers move from raw logs to understanding more quickly, without disrupting existing workflows or replacing expert judgment.
Research
Developer experience - Research evidence
I collaborated closely with engineers, UX researchers, and platform teams to understand real debugging behavior—focusing on where developers lost time, context, and confidence during triage.
Developers reported:
- Spending 3+ hours per bug during initial triage, before forming a confident hypothesis
- Lacking trust in automated recommendations due to unclear reasoning
- Difficulty correlating log output with Buganizer context and source code
Developer Quotes:
“Initial bug triage often took multiple hours, as engineers manually scanned massive log volumes to determine where to start.”
“Android developers spent hours parsing unstructured logs, manually linking issues across source code and bug reports.”
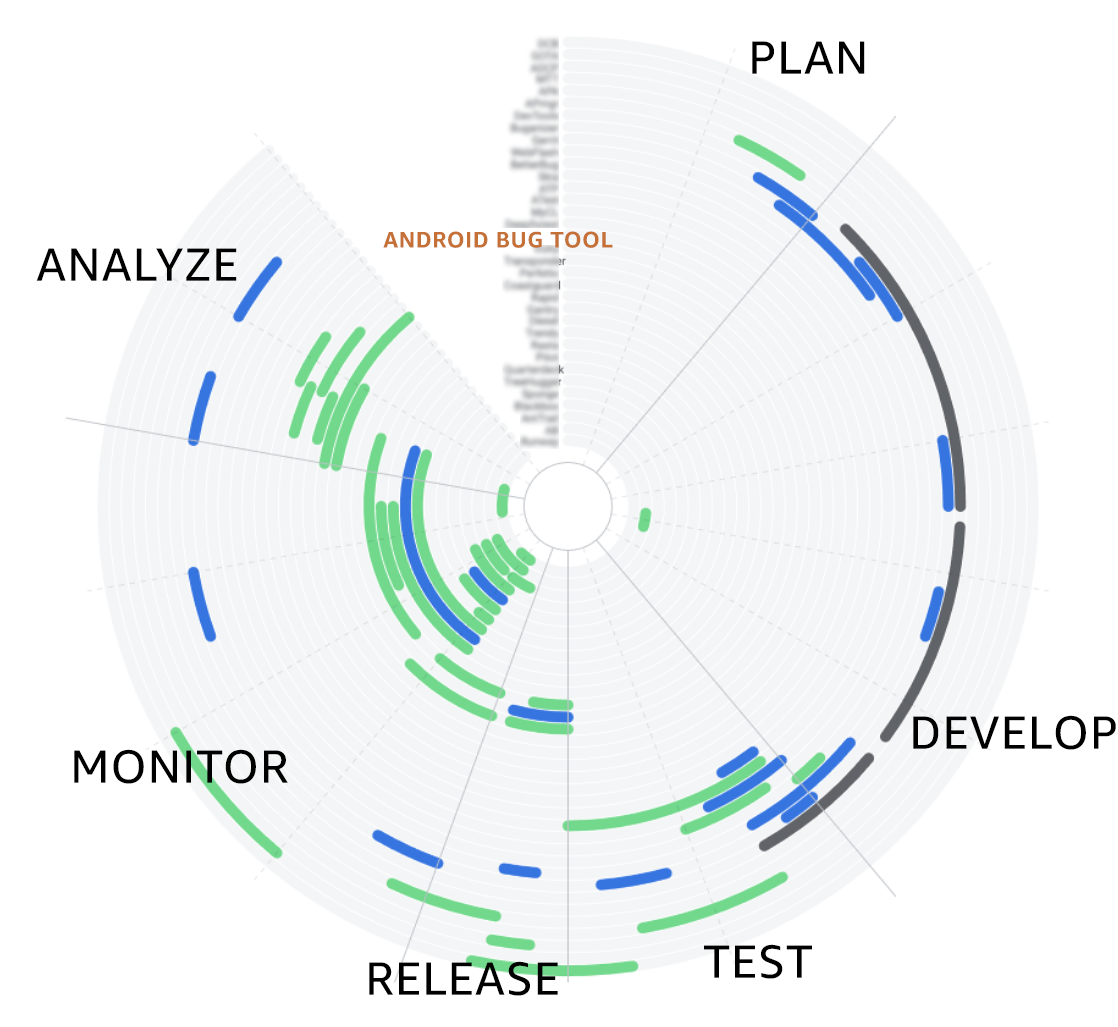
Developer Workflow and ABT
Android Debugging Tool Ecosystem spans multiple tools each supporting a different stage of the development and release lifecycle. Buganizer manages bug lifecycle and access, while ABT is the primary environment for log analysis and investigation
The transition from bug management to log analysis is where developers spend the most time—and where AI assistance has the highest impact.
Debugging workflows
Before: Manual, High-Uncertainty Triage
Developers manually scanned raw system logs with limited guidance on relevance.
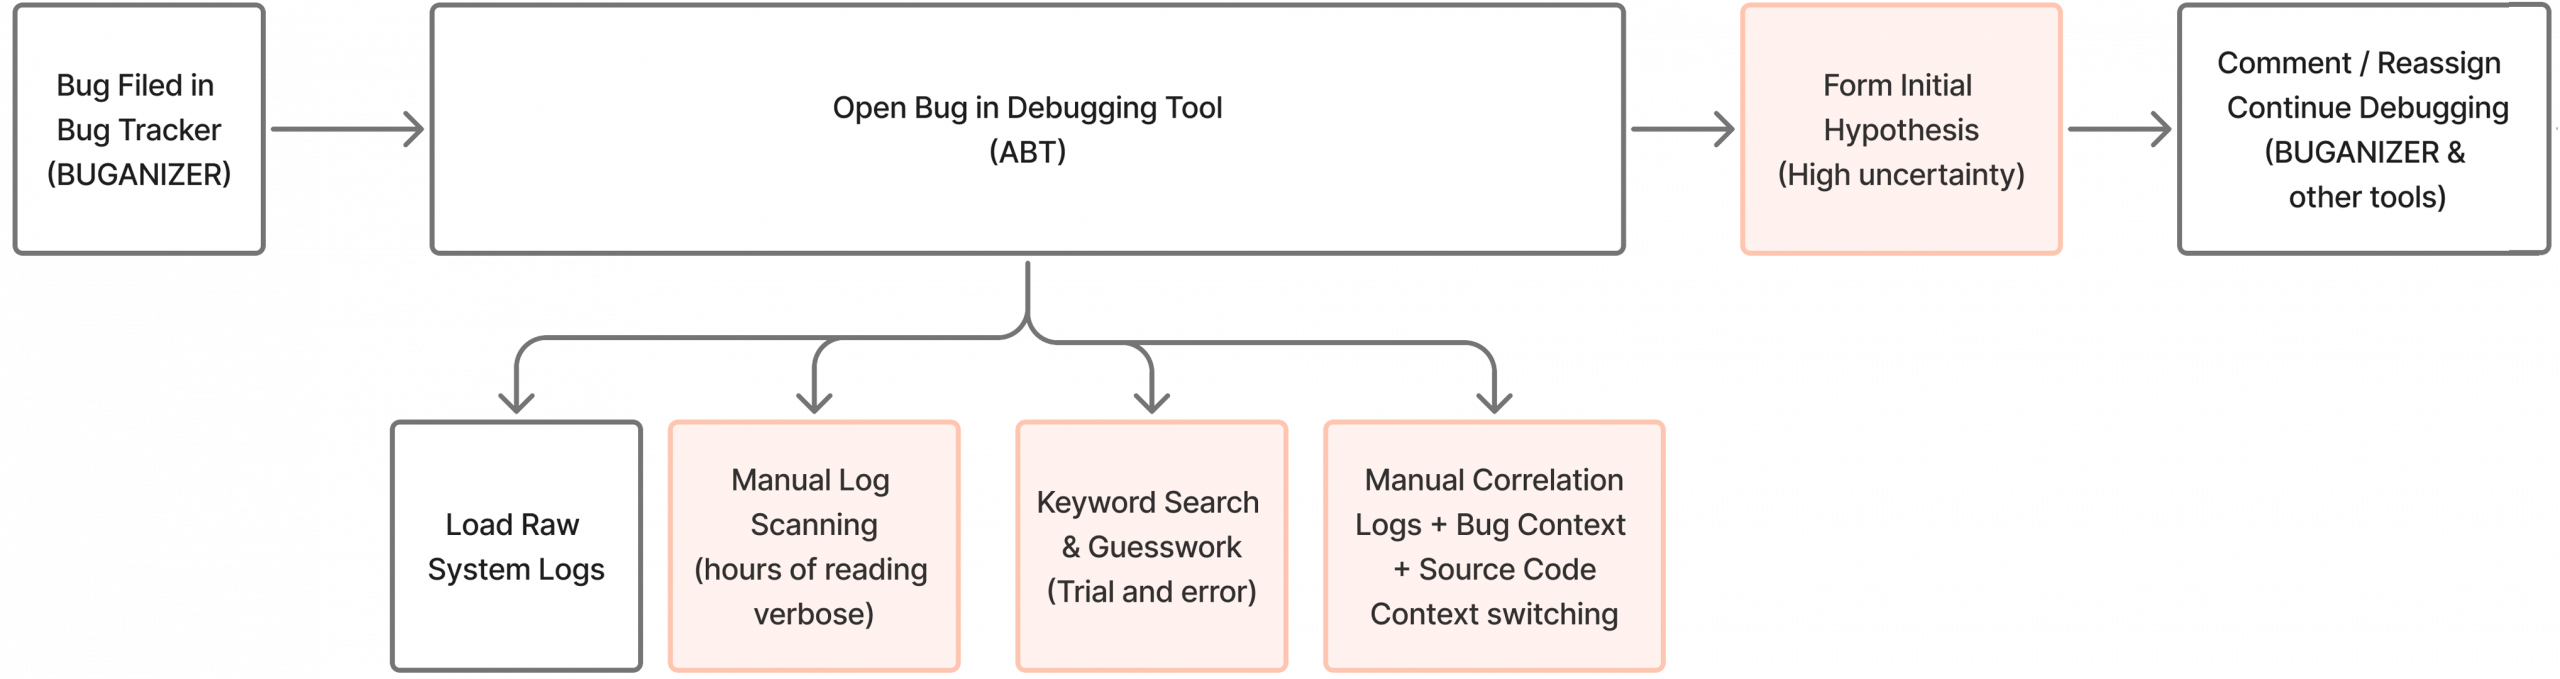
Before AI-assisted features, debugging was dominated by manual discovery during early triage.
Manual scanning of large log files
Engineers sifted through massive, unstructured system logs to locate potential signals.
Repeated context switching between tools
Understanding an issue required jumping between the bug tracker, log viewer, and source code with little system support for correlation.
High uncertainty during early triage
Developers often spent hours just determining where to start before forming an initial hypothesis.
After: AI-Assisted
AI-assisted features guide developers from raw logs to understanding through relevance, visualization, and explanation.
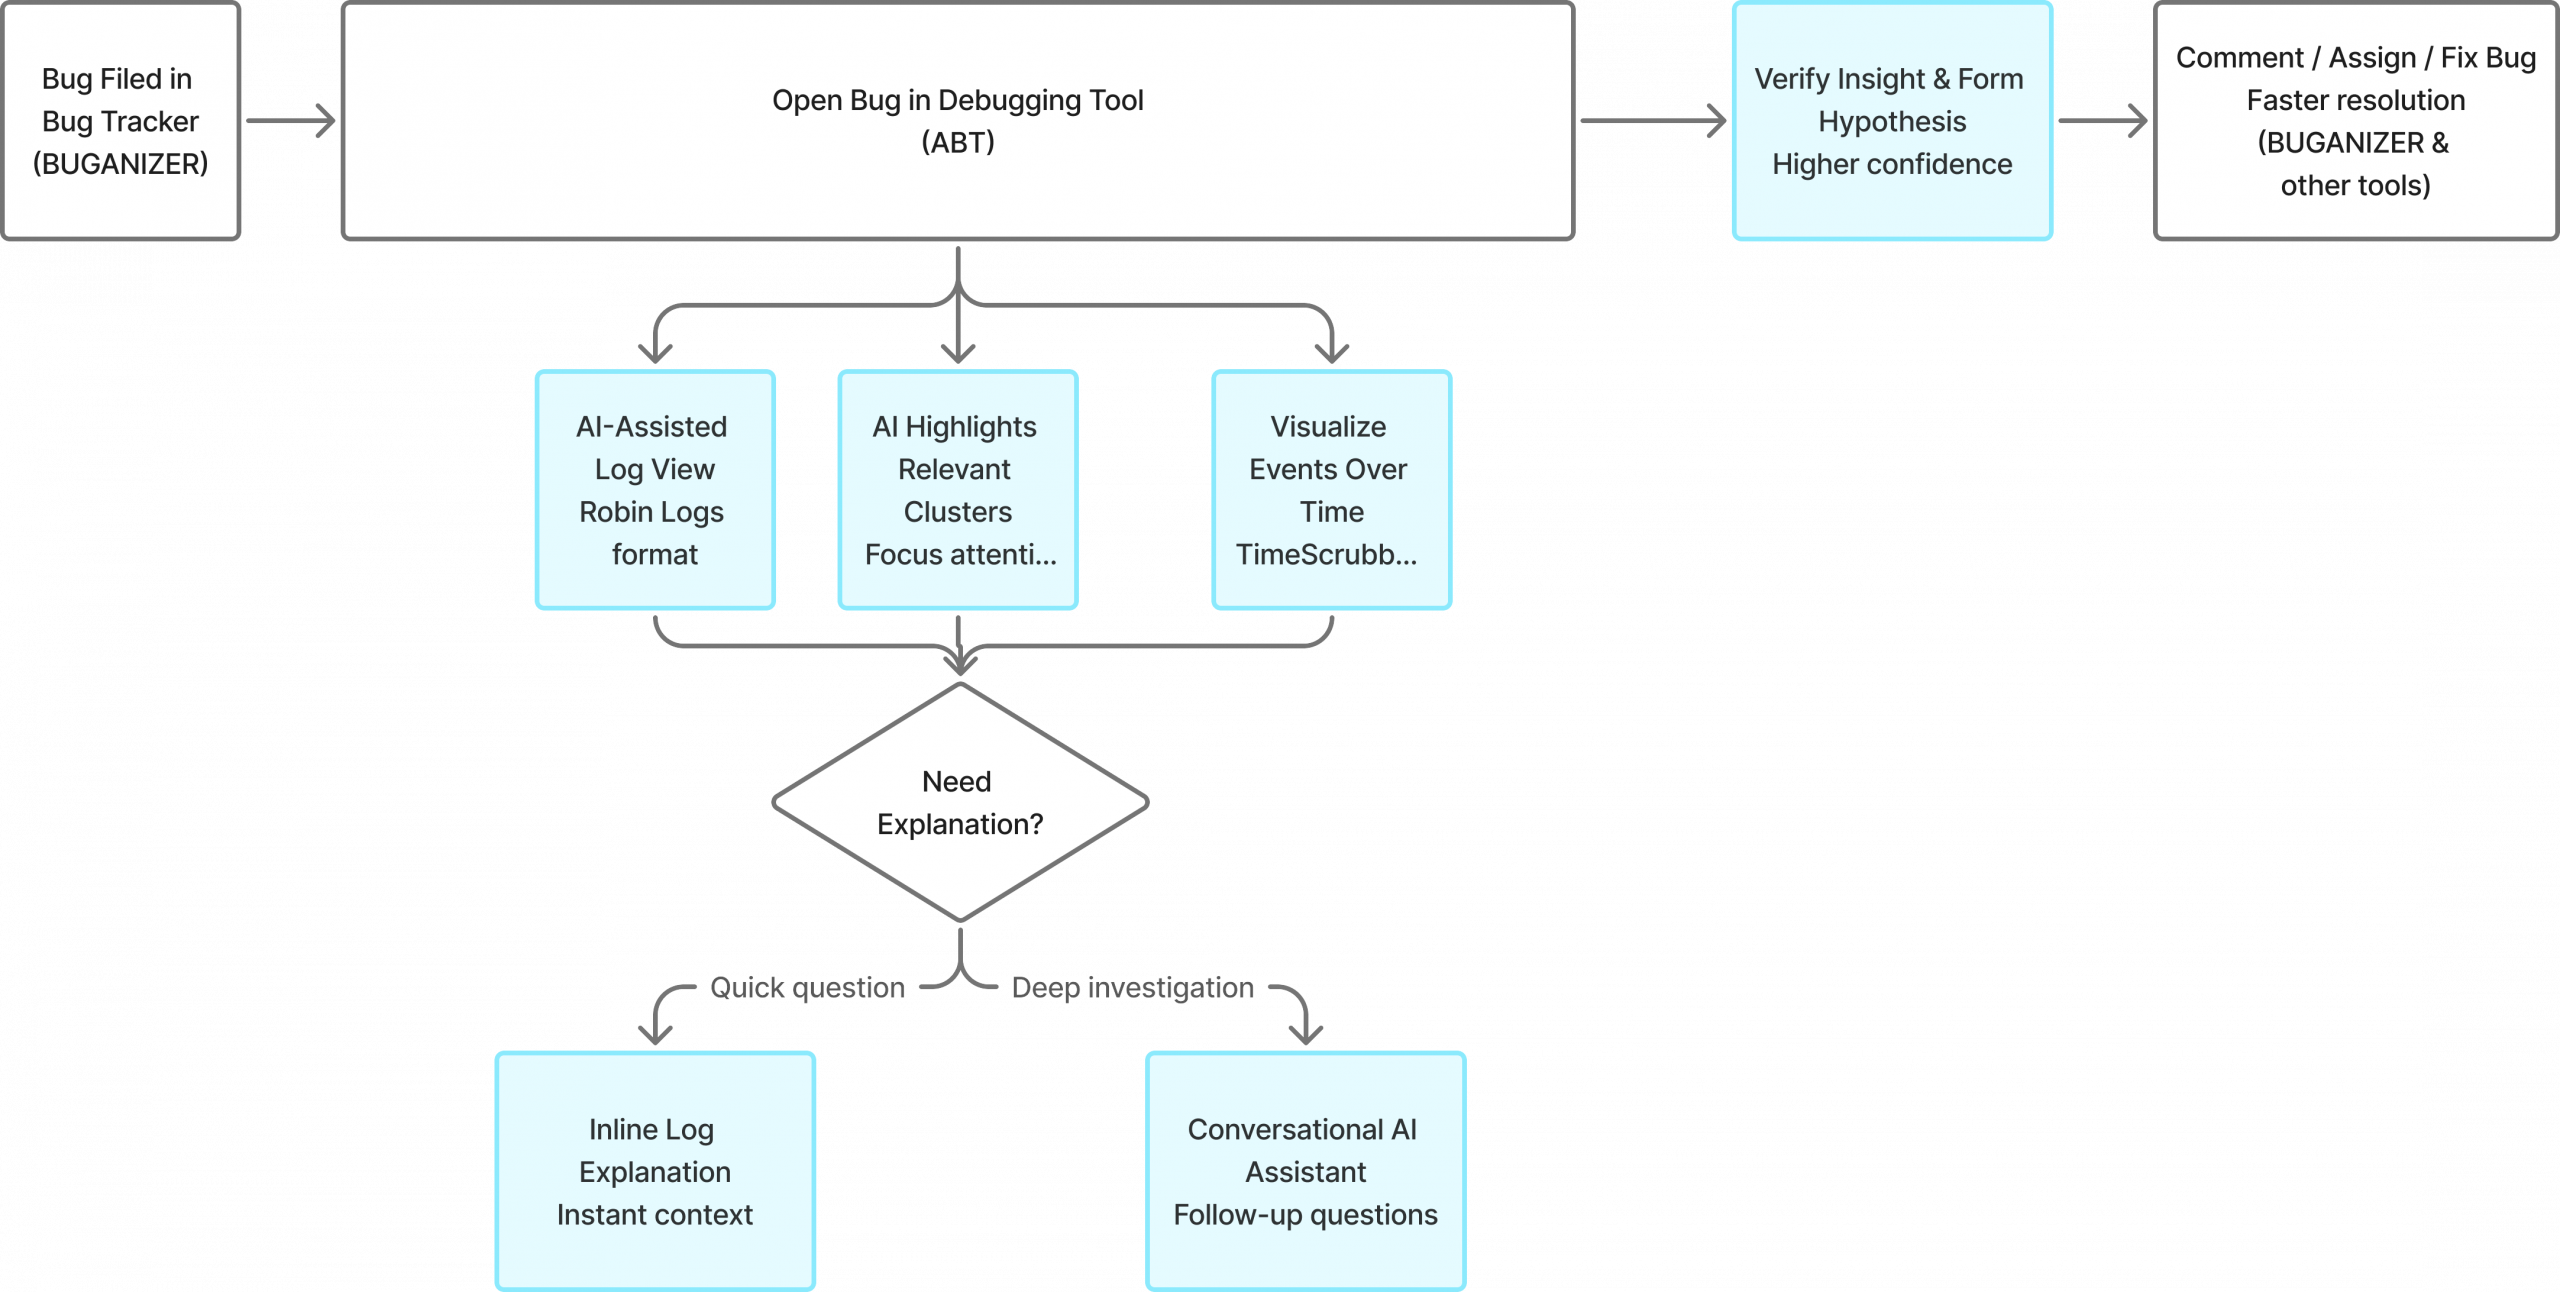
With AI integrated directly into the debugging workflow, triage shifted from manual discovery to assisted reasoning.
AI-assisted relevance highlighting
Robin Logs surface high-signal log clusters, significantly reducing time spent searching.
Visualization of event sequences
Temporal views help developers reason about when events occurred and how failures unfolded.
Contextual explanations at the right depth
Inline and conversational explanations help developers move from raw data to understanding faster.
What existed before ?
Duckie operated largely outside of ABT as a standalone AI experience Developers had to leave their debugging workflow to access AI assistance.
Explain Logs existed as a hidden, experimental setting Limited discoverability meant most developers never knew the feature existed.
No shared context between logs, bug reports, and AI assistance Each tool operated in isolation, requiring manual correlation across systems.
Limited adoption due to trust and discoverability issues AI felt adjacent to debugging, not embedded within it.
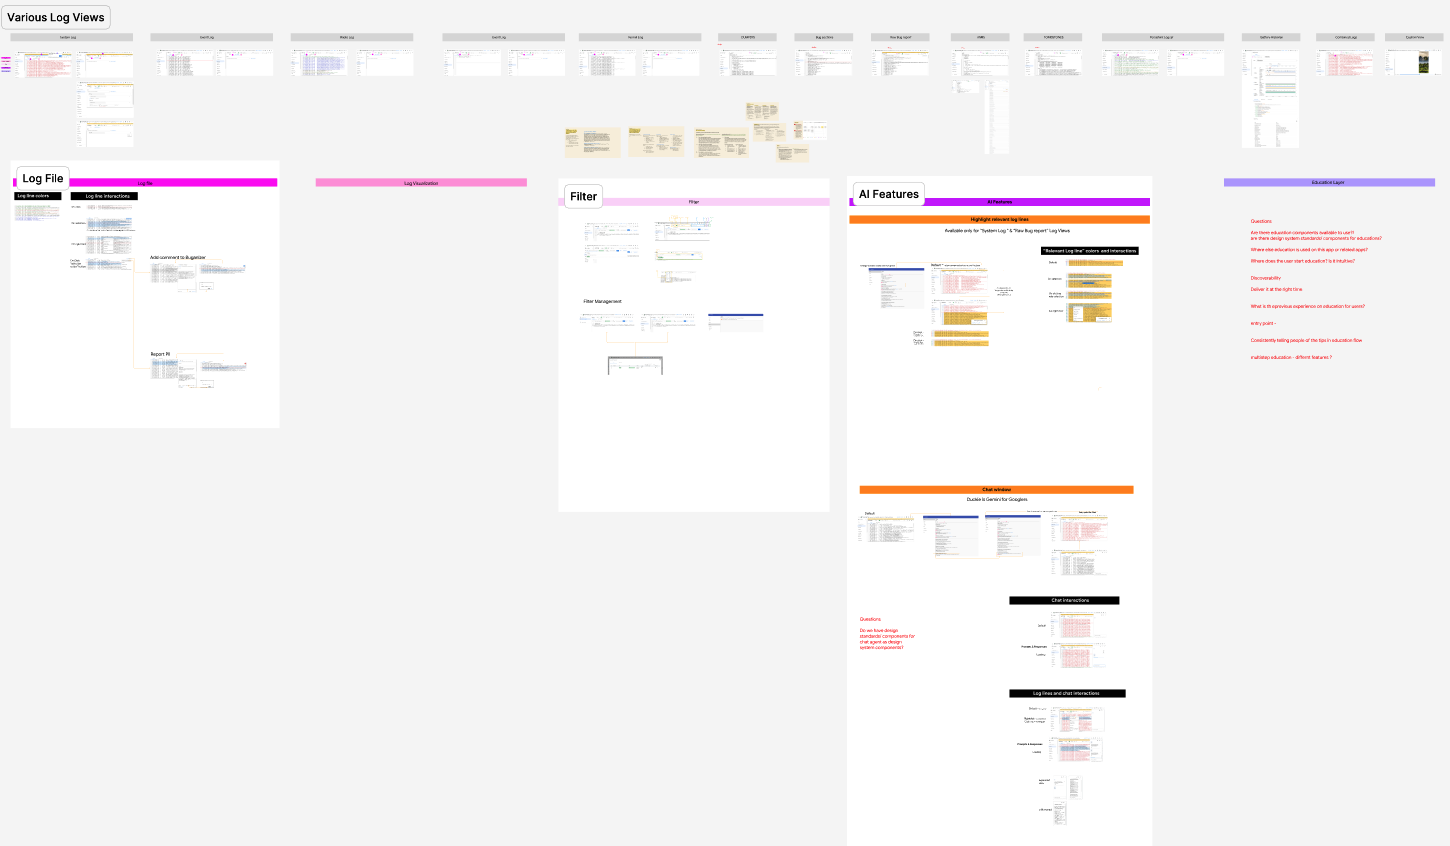
IA review of Android Bug Tool - Debugging workflow mapping
I mapped the existing information architecture of the debugging tool against the end-to-end debugging workflow to identify: Breakdowns during early triage, Opportunities for AI intervention, Places where explanation and visualization could reduce cognitive load
This mapping informed where AI features should live without disrupting established workflows.
What I designed
I designed these features into a cohesive system of AI-assisted interactions that augment developer reasoning across triage, investigation, and verification, with explicit boundaries for explainability, trust, and human control.”
Log Understanding
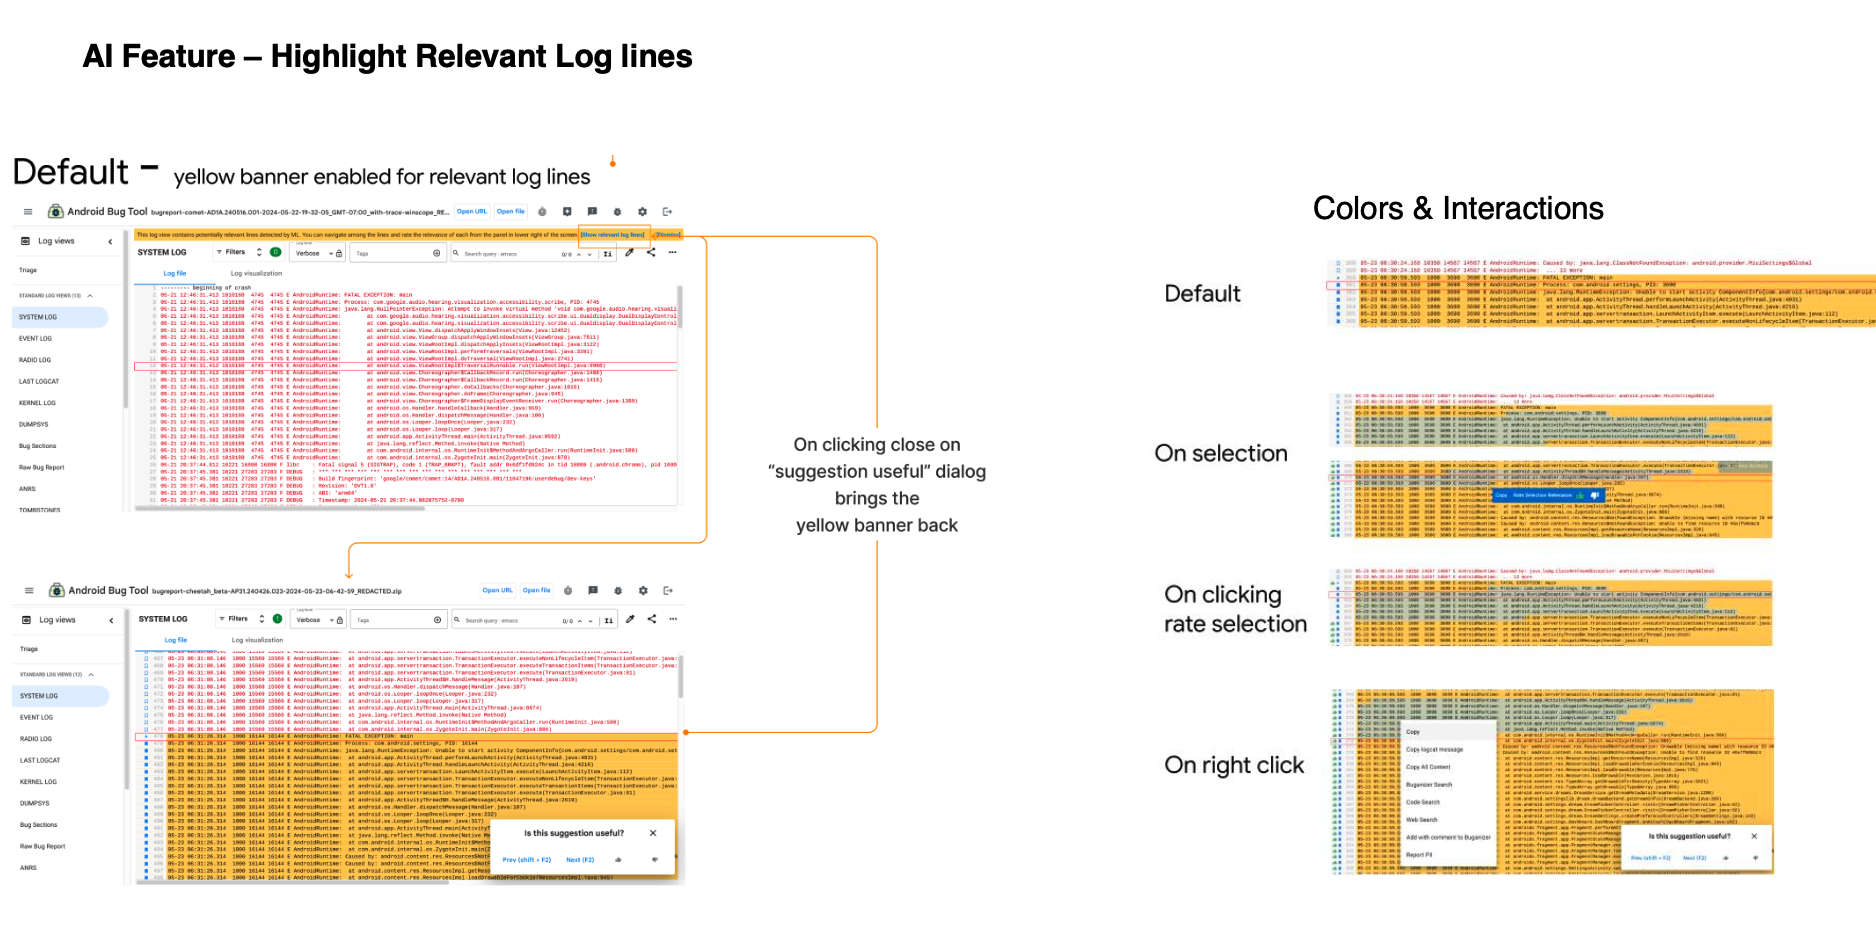
Highlight Relevant Logs (Micro-Interaction)
AI highlights relevant log lines and clusters directly within the log viewer, guiding attention during initial triage while keeping raw logs visible.
I designed a highlighting system using:
- Visual banners that draw attention without obscuring content
- Confidence indicators showing AI certainty levels through color intensity
- Inline feedback mechanisms allowing developers to validate or correct AI suggestions with thumbs up/down
- Cluster grouping that surfaces patterns across related log entries
This approach balanced signal amplification with developer control—AI guides attention but doesn't hide information or make irreversible filtering decisions.
Highlight Relevant Logs (Micro-Interaction)

Highlight Relevant Logs (Micro-Interaction)
Visualization of logs - Time-scrubber interaction
Time-based visualization helps developers understand when events occurred and how failures unfolded, supporting causal reasoning instead of manual inference.
I designed TimScrubber, an interactive timeline that:
- Maps event density across the debugging session, showing where activity clustered
- Provides hover-triggered summaries for quick context without leaving the log view
- Uses color coding to distinguish error severity (critical, warning, info)
- Enables temporal navigation so developers can quickly jump to relevant time windows
This visualization transformed the cognitive task of "when did this happen?" from manual log scanning into immediate visual pattern recognition.
Log Explanation
Inline log explanation | Conversational log explanation
Log explanation
Inline log explanation
Developers can select specific log lines to receive concise, inline explanations—designed for quick clarification without breaking debugging flow.
I designed an explanation interface featuring:
- Plain-language summaries that translate technical logs into understandable explanations
- Relevance reasoning explaining why this log matters for the current investigation
- Common causes providing typical scenarios that produce this log pattern
- Quick actions like "Show similar logs" or "Search code references."
- Inline feedback with thumbs up/down to improve future explanations
This micro-interaction reduces the friction of getting help—developers don't need to formulate a question or leave their workflow to understand a specific log entry.
Conversational log explanation (Macro Interaction)
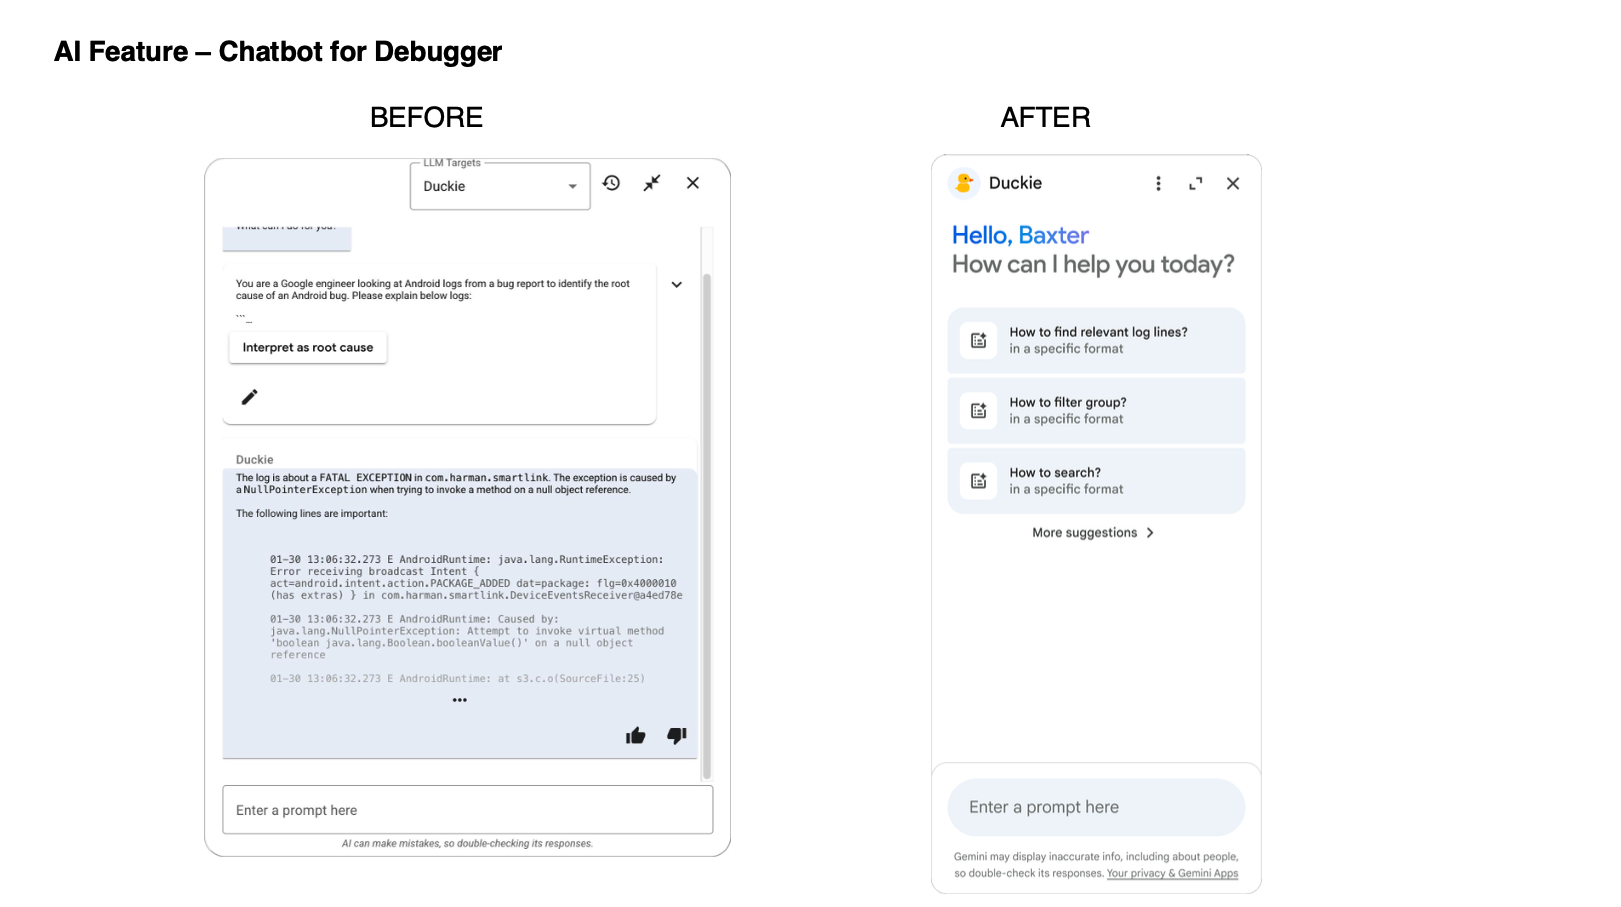
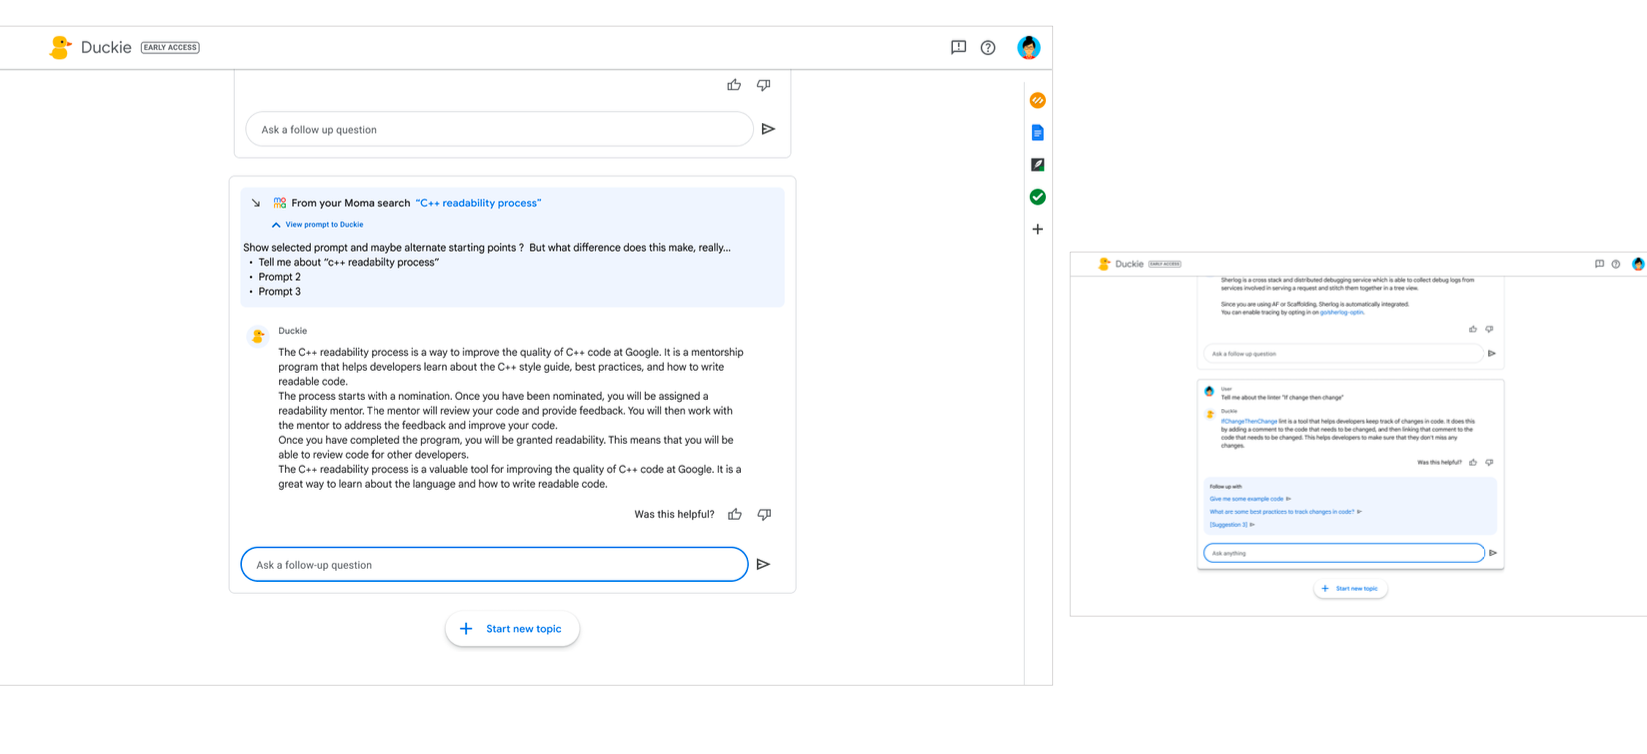
A conversational GenAI assistant embedded in ABT supports deeper investigation through follow-up questions, scoped to the debugging session.
I designed the Gemini integration with:
- Contextual awareness of the current bug, selected logs, and debugging history
- Multi-turn conversation supporting progressive investigation
- Suggested prompts to help developers ask better questions
- Source attribution linking AI explanations back to specific log lines
- Transparency indicators making clear when AI is uncertain
The assistant operates within the ABT interface rather than as a separate tool, maintaining debugging flow and providing context-aware responses.
Log explanation with AI Assistant
Log explanation with AI Assistant
New log format & Landing experience
Robin logs - Intelligent log format
Robin logs are only generated when the user has the Bard/Gemini app installed and has used it during the time covered by the system logs.
The additional challenge is that Bard/Gemini bugs are highly confidential and access-controlled.
The triagers/SWE must be on the Gemini/Bard team to have access in most cases.
A redesigned log format structures raw output into scannable, intelligible clusters, enabling relevance highlighting, explanation, and visualization.
I redesigned the log presentation to make it both AI-comprehensible and human-friendly:
- Clustered organization grouping logs by source (UI, System, Network) rather than purely chronological
- Scannable hierarchy using visual weight and spacing to distinguish error severity
- Embedded AI affordances placing "Explain this log" actions within the reading flow
- Inline metadata surfacing relevant context (process IDs, timestamps, tags) without requiring navigation
- Progressive disclosure showing summary information first, with expansion for detailed content
This structured format served as the foundation for both AI analysis and human comprehension, making logs more accessible without sacrificing technical detail.
Landing Page — Open a Bug in ABT
A streamlined entry experience helps developers move from Buganizer into ABT with clearer context and faster orientation during triage.
I redesigned the entry flow to provide:
- Bug context summary at the start of the debugging session
- Automatic log loading with progress indicators
- AI readiness indicators showing which assistance features are available
- Quick actions for common triage tasks
- Recent activity showing what other engineers have investigated
This reduced the initial cognitive load of starting an investigation, helping developers orient themselves more quickly.
Homepage for ABT
REFLECTION
- Visual metaphors (like TimeScrubber) turn overwhelming data into human intuition.
Temporal and spatial representations helped developers reason about complex system behavior faster than raw logs. - AI trust is designed, not given.
Visible reasoning, confidence cues, and feedback loops directly shaped adoption and reliance. - Prompt design = interface design.
Small changes in wording, scope, and defaults had outsized impact on how developers interpreted and trusted AI output. - System design mattered as much as UI.
Integrating AI affected workflows, entry points, and mental models across the debugging ecosystem—not just individual screens.
RESULTS
The redesigned AI-assisted debugging experience transformed the tool into a context-aware system that bridges ML models, visual cognition, and developer experience. Robin Logs and TimeScrubber established foundational patterns for future AI-first debugging tools—shifting debugging from manual discovery to assisted sensemaking within the Android ecosystem.
Metric
Before
Debugging Time
~3 hrs
Log Relevance Accuracy
~61%
Developer Trust in AI
Low
Feedback Completion
n/a
After
~1.5 hrs (↓ ~50%)
89% (↑ ~1.45×)
High (↑ ~2.4×)
~80%
Why it Changed (Design Rationale)
Relevance highlighting and log visualization (TimeScrubber) reduced time spent searching and orienting during early triage.
Robin Logs and AI-ranked log highlighting focused attention on high-signal log clusters without hiding raw data.
Visible reasoning, inline explanations, and explicit feedback loops made AI behavior inspectable and verifiable.
Lightweight, in-context feedback UI lowered friction and reinforced trust calibration rather than passive consumption.
Metrics are directional and based on internal testing, validation sessions, and qualitative developer feedback.