Designing Spatial ML Recommendations
I was responsible for the end to end UX, for an Oil & Gas - maps based SaaS enterprise product. Designed for data visualization solutions handling huge volumes of data with map interaction. This Product allows managers, geologists to interpret and identify problems quickly, which in turn delivers better decision making and prediction for drilling new wells, exploration, planning, and production.
Geo data models created in another application are used for spatial ML recommendation
I designed for expert technical users:
Related Casestudies : Design System Initiative | Feature Updates for Data Visualization
My Role
Lead UX Designer/Researcher
My Responsibilities
End to end UX of the product
60-70 hours of User Interviews
Concept Ideation
Collaborate with Multiple vendors (Maplarge,INT, Internal team)
Our Team
Lead UX Designer/Researcher
Solution Architect
External Stakeholders - 2 groups
Internal Stakeholders - 5 groups
10+ SCRUM Team Members
Vendors from Maplarge, INT
Best Practices
4 Fullday workshops I facilitated for UX effort
Helped with Product Strategy
Videos of Interactions for the team
Educating team on Design System
Design System Adoption
UI components from multiple Vendors
This case study contains my own views and does not reflect the views of the organisation
Project Overview
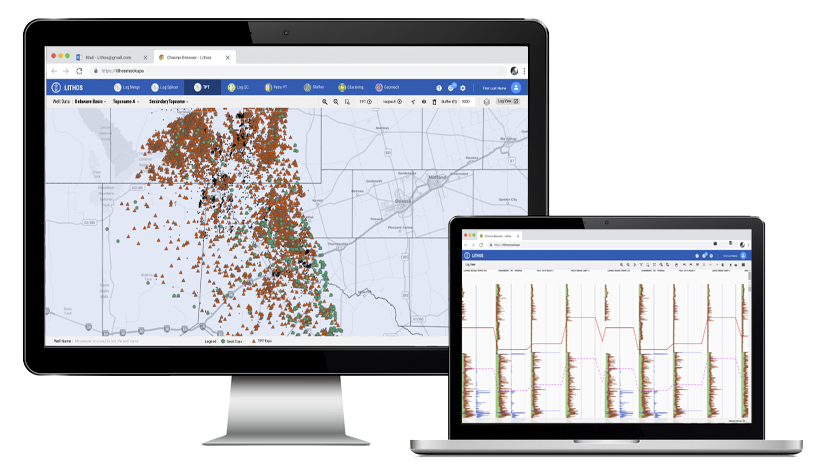
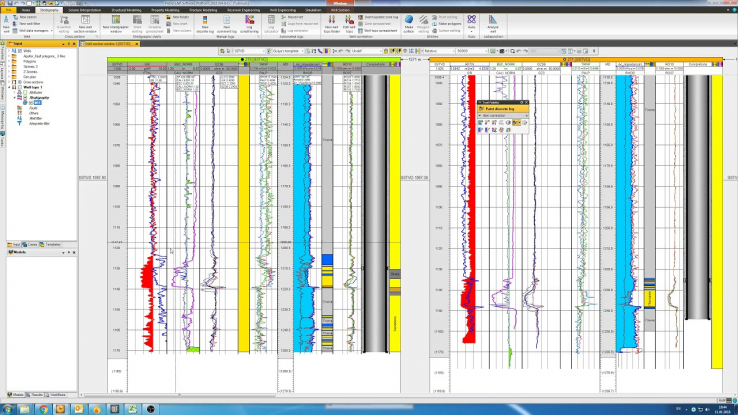
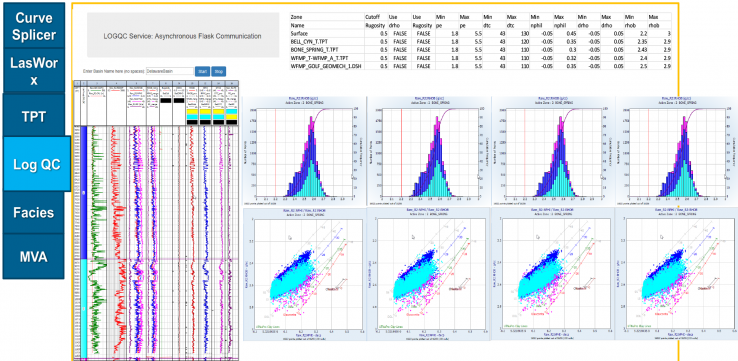
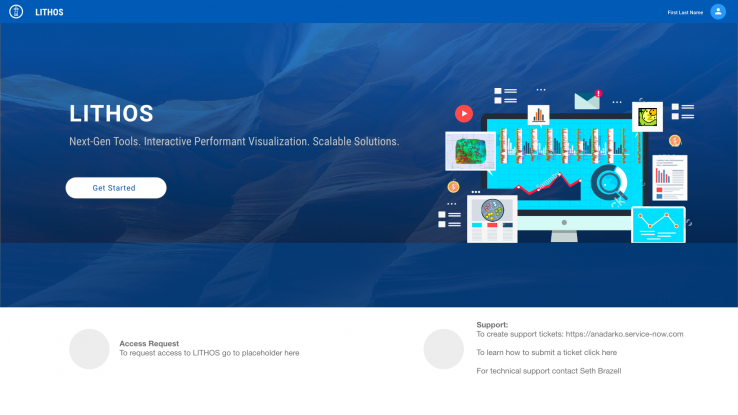
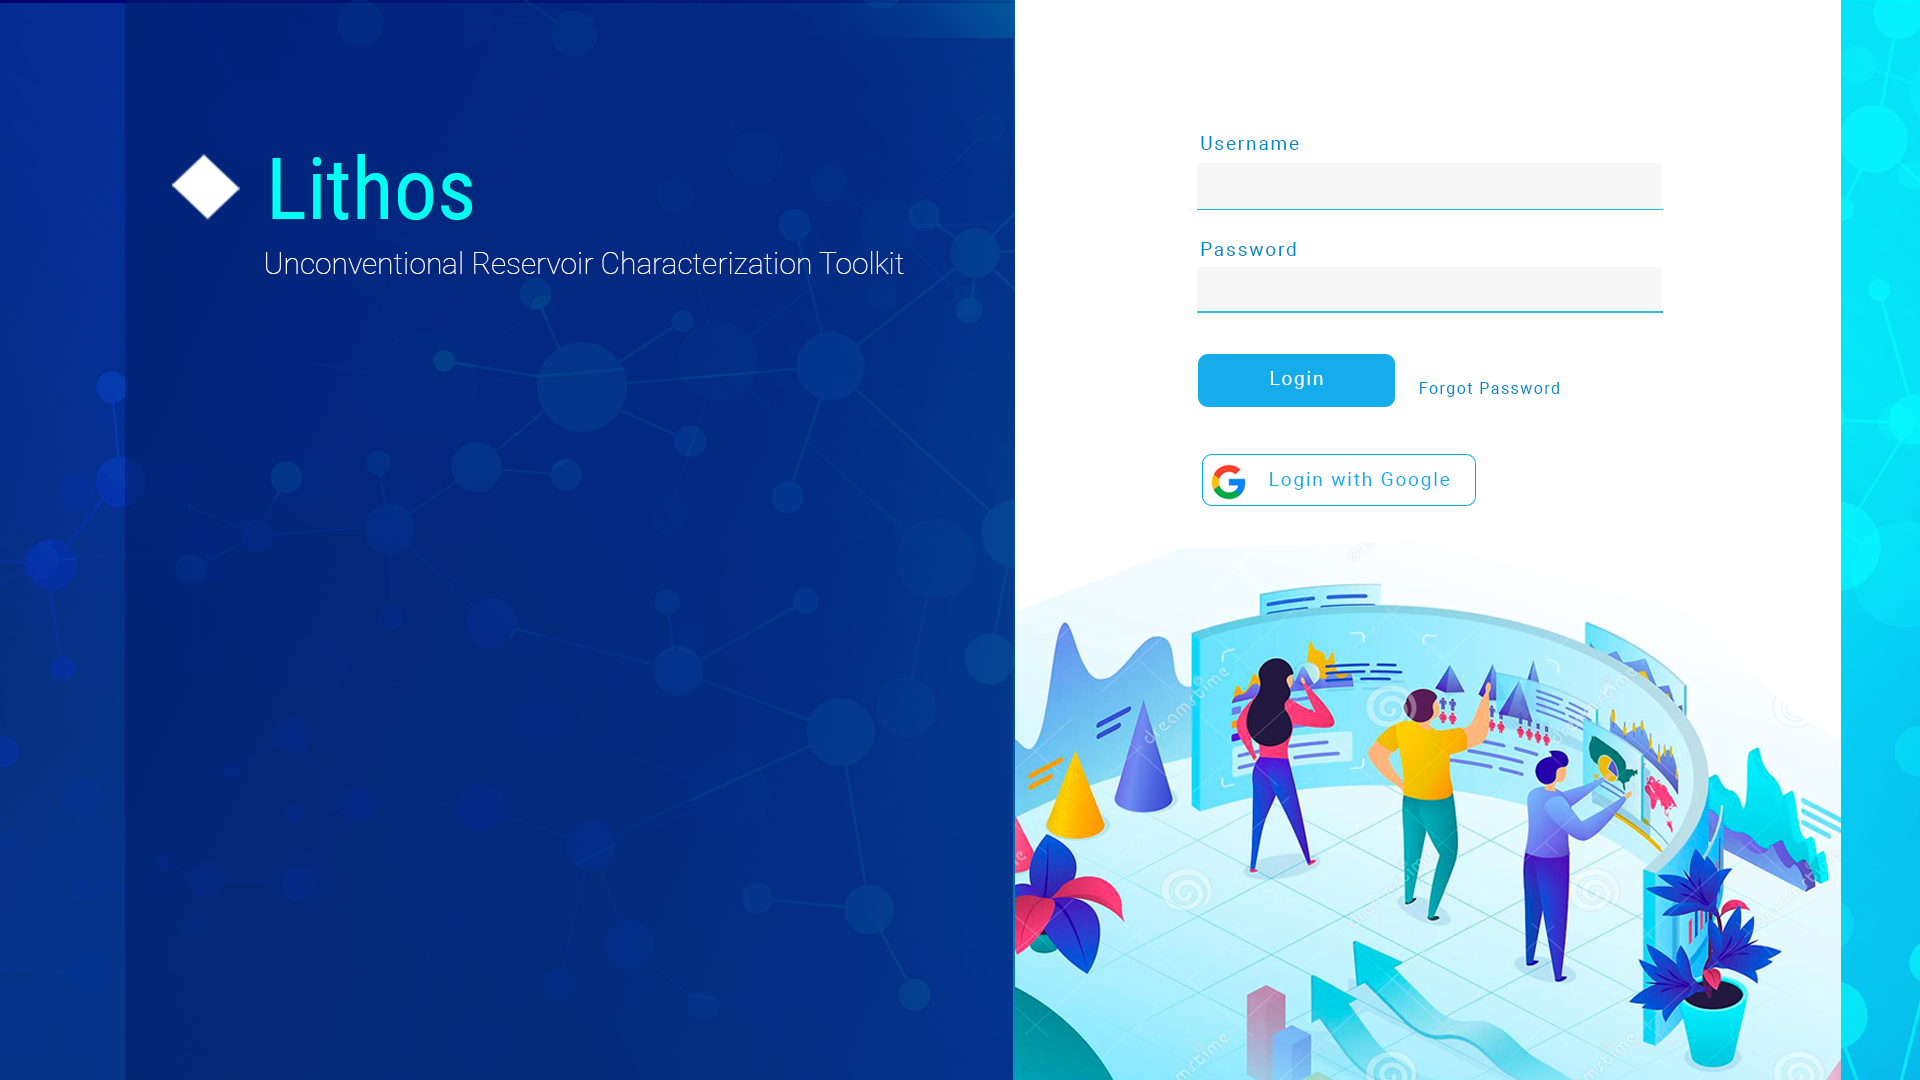
" This product provides interactive - multiple log views, maps view, and 3D views of the earth's surface and drilled hole structure. Works with large modeled data for unconventional oil and gas assets by providing data visualization solutions. Thus allowing managers, geologists to identify problems quickly, which in turn delivers better decision making and prediction for drilling new wells, exploration, planning, and production.
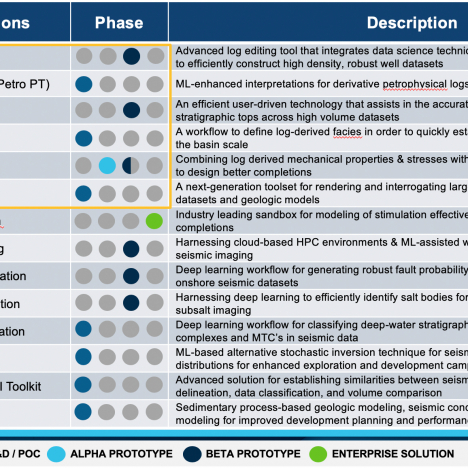
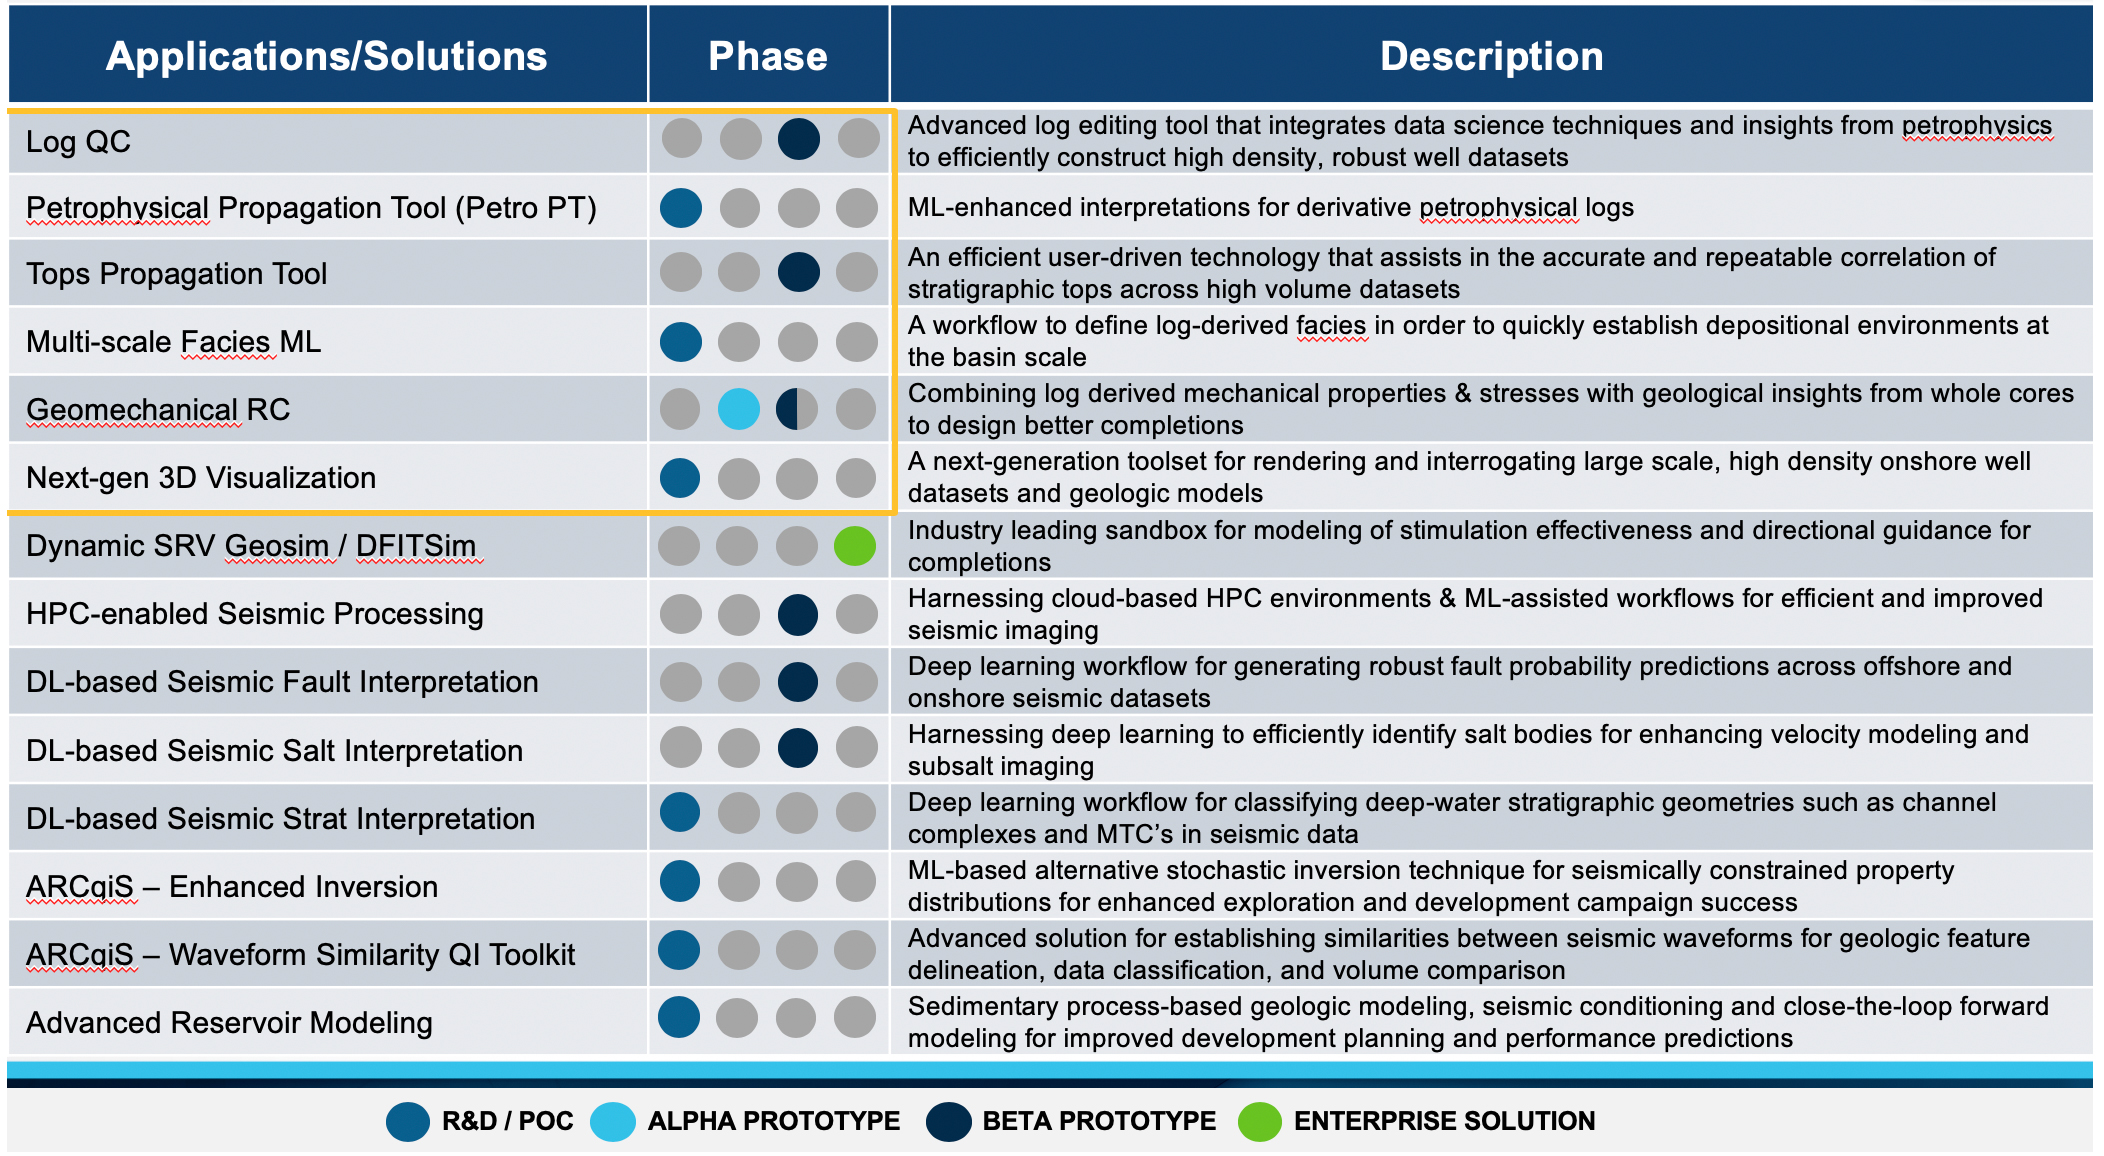
Lithos (Project Name) was aimed at being a commercial tool, it remained as an interim solution until it was commercially released. Lithos is a collection of easy to use, internally generated tools for major reservoir characterization workflow bottlenecks that are capable of handling large datasets. Initially named as Unconventional Reservoir Characterization Toolkit, later named as Lithos to make it a commercial tool.
Worked with Data scientist/ Geologist so that the AI models they build have good user experience. The experience I designed helped in gathering and data prep, developing methods to make clean and meaningful data so that they build the AI model.
Some of their activities include:
Articulating the problem in categories such as classification, clustering, regression, and ranking
Establishing data collection mechanisms
Checking the quality of the data
Formatting data to ensure consistency
Reducing data
Completing data cleaning
Creating new features from existing ones
Joining transactional and attribute data
Rescaling data
Discretizing data
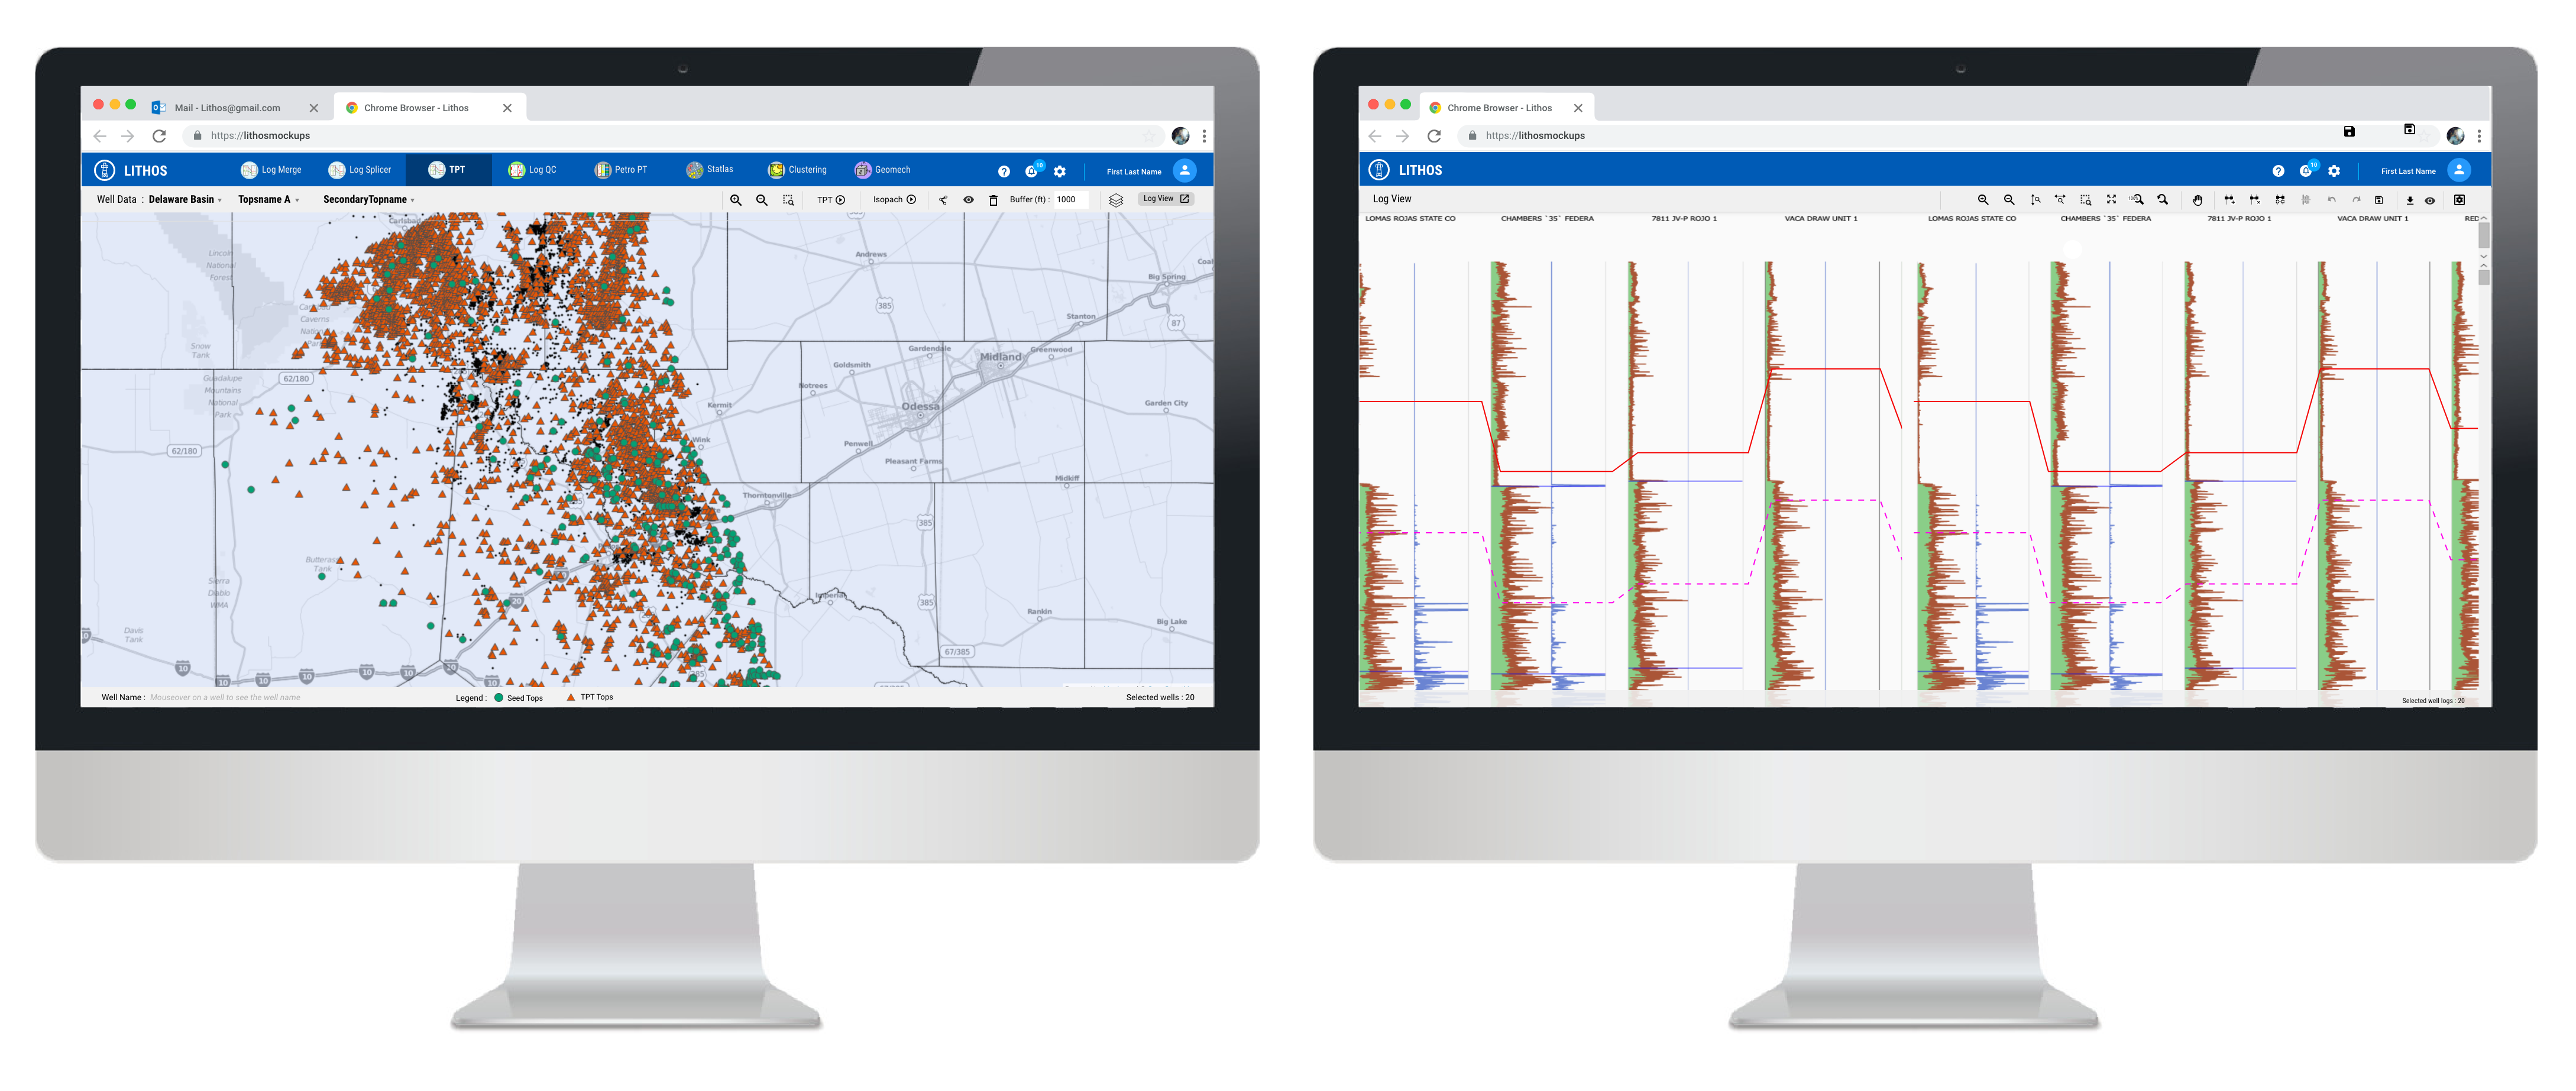
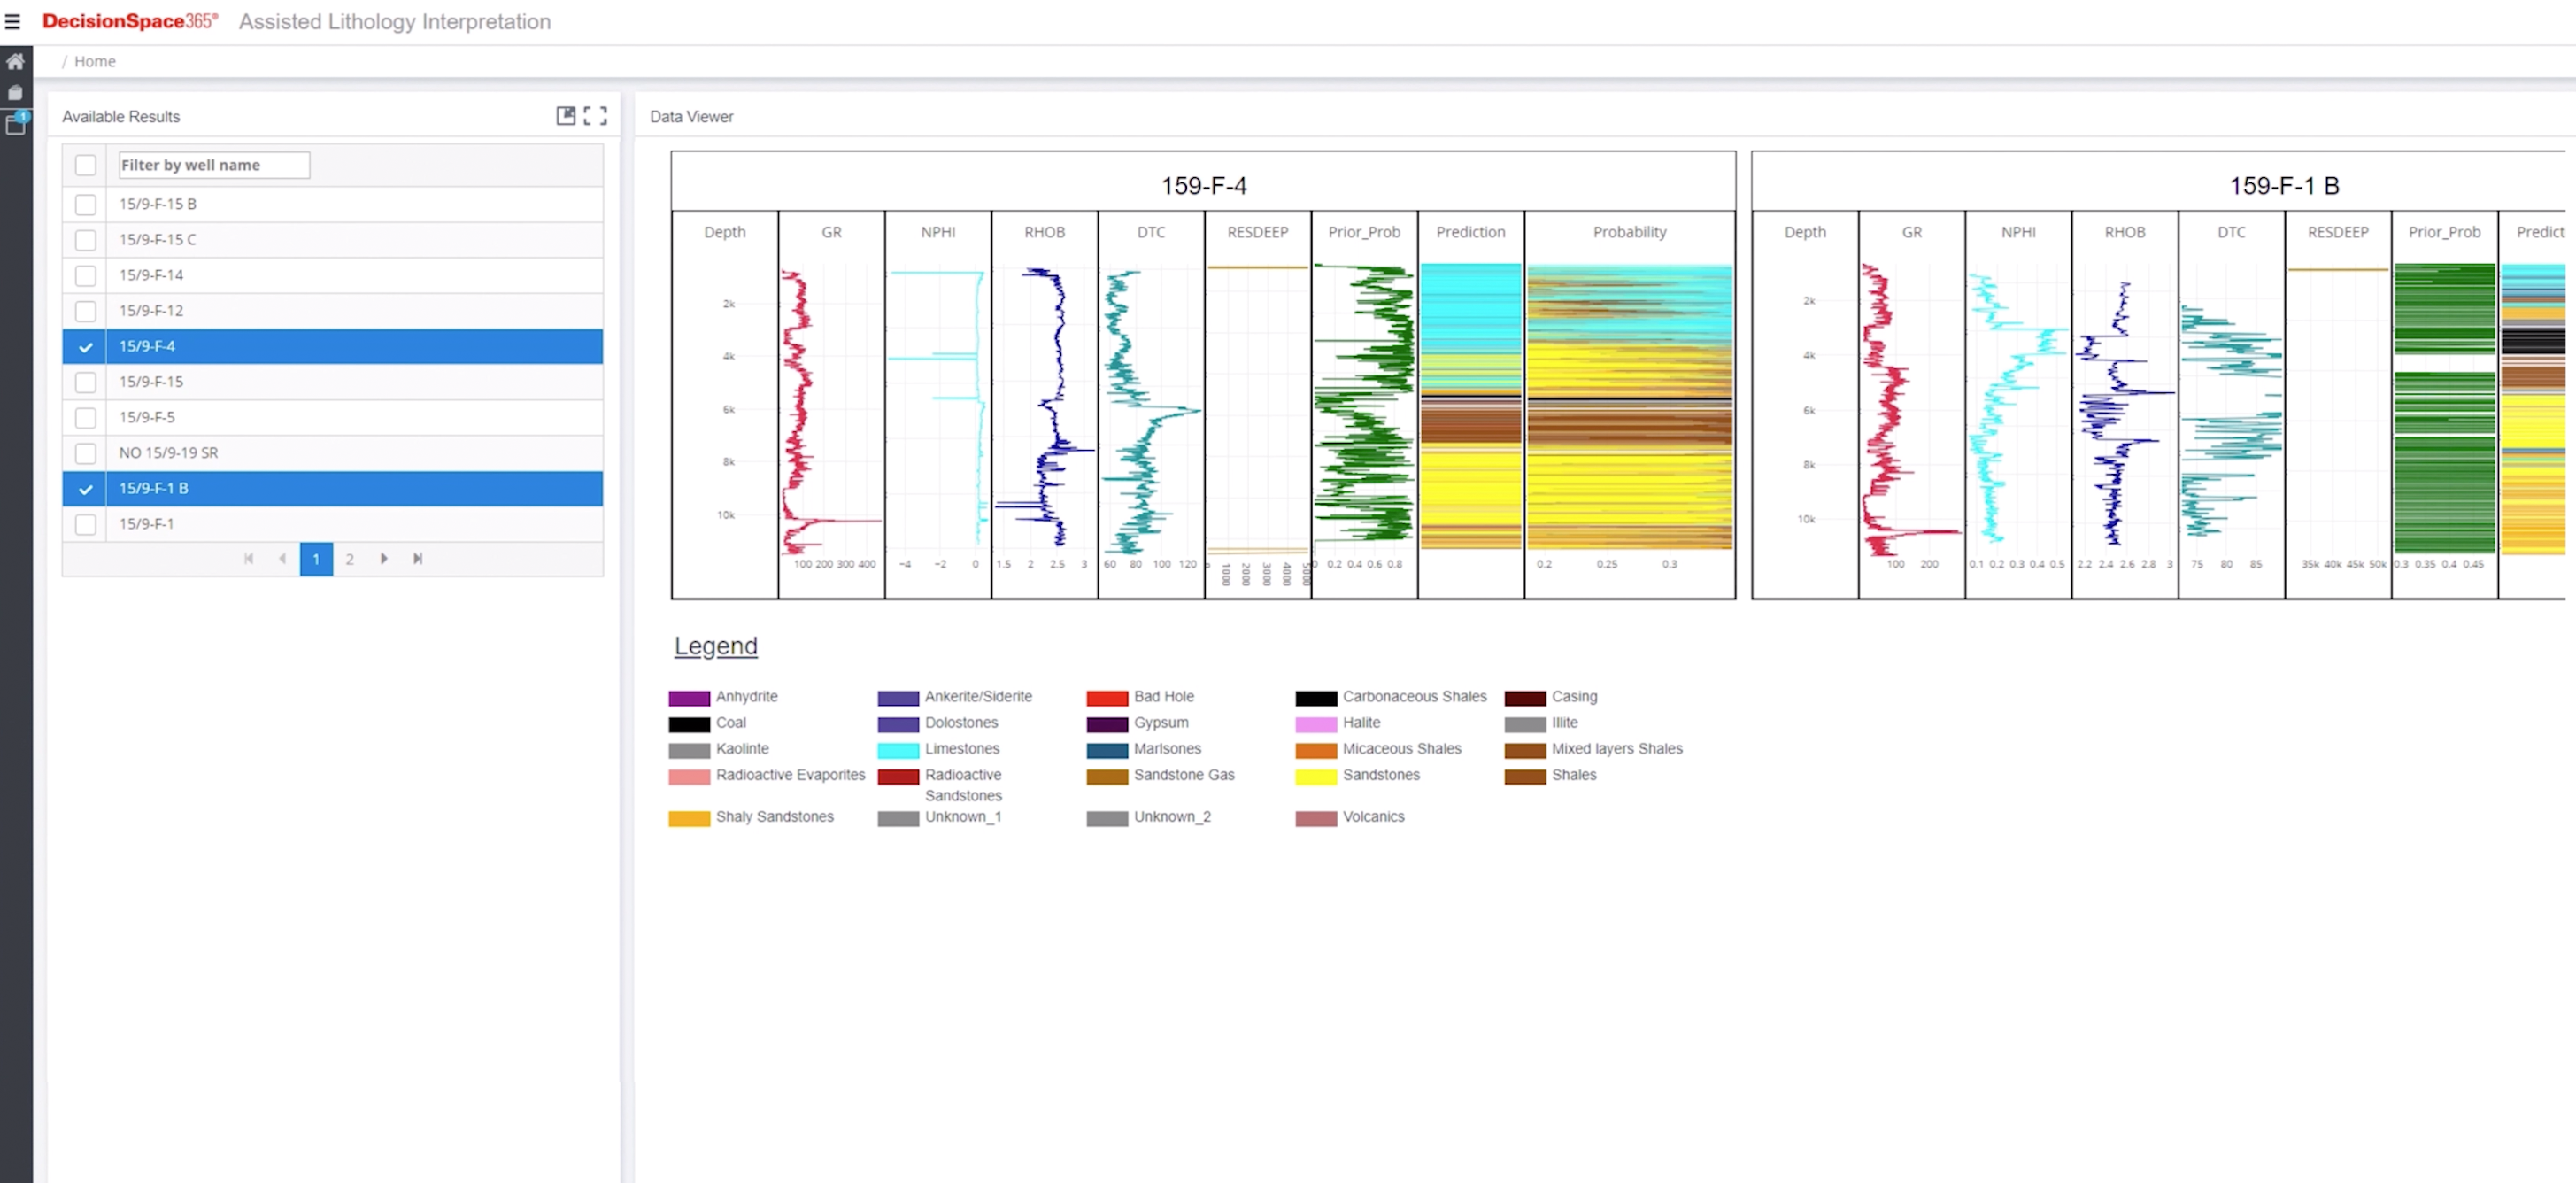
Lithos - Interactive Maps & Log Viewer
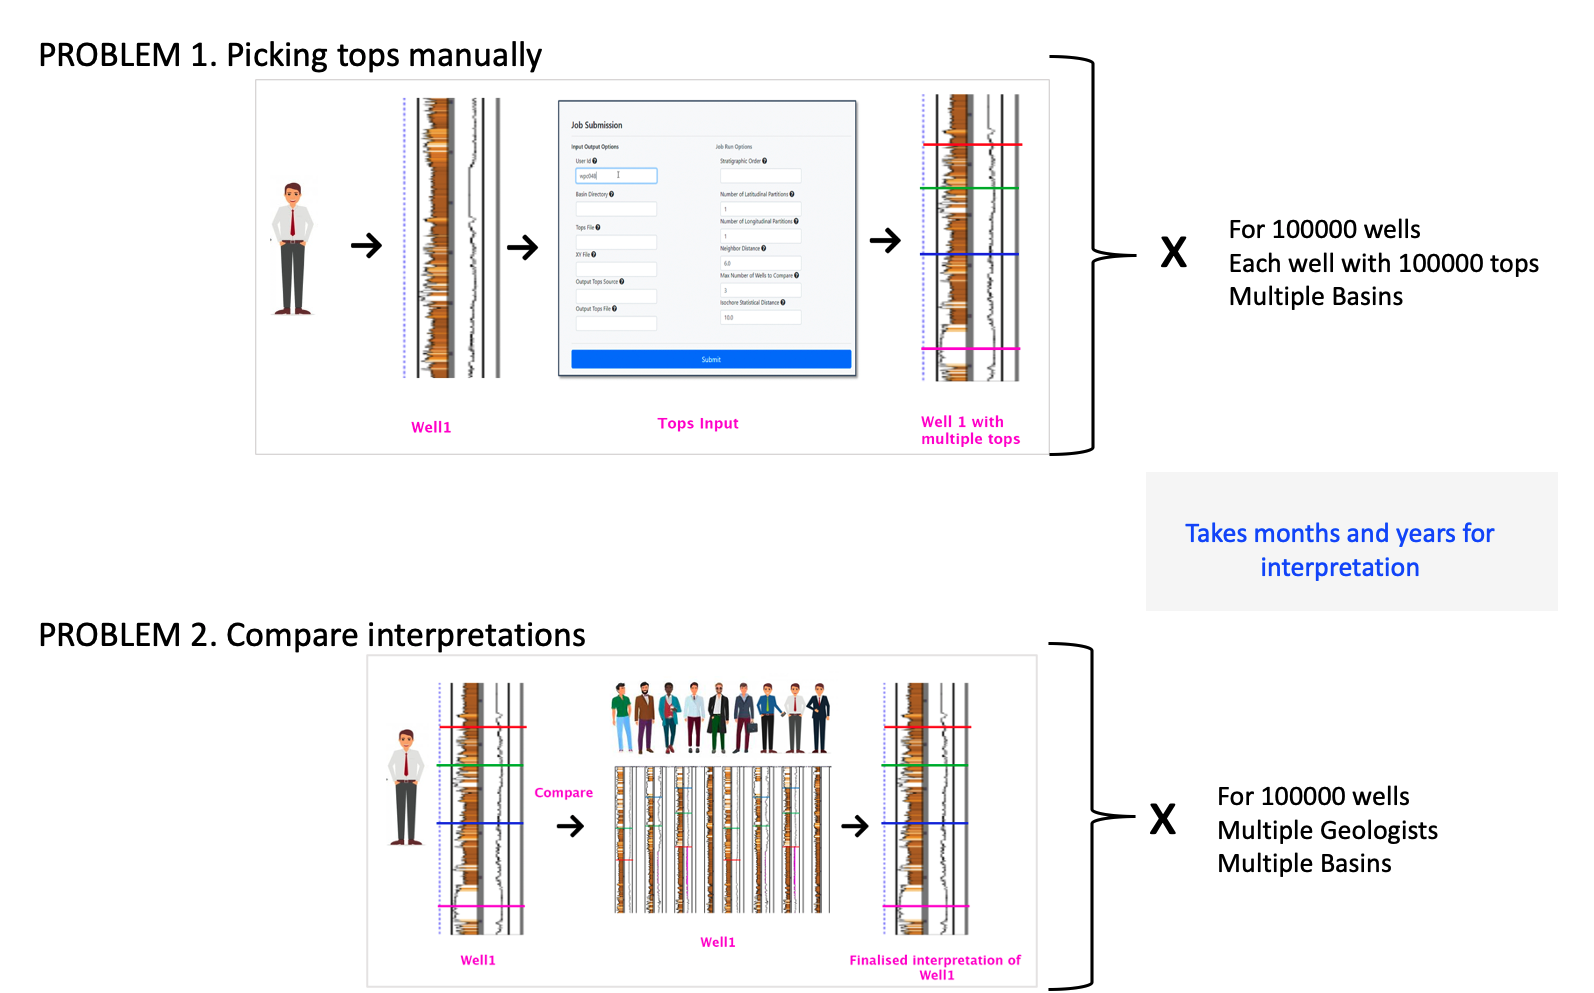
Business Problem:
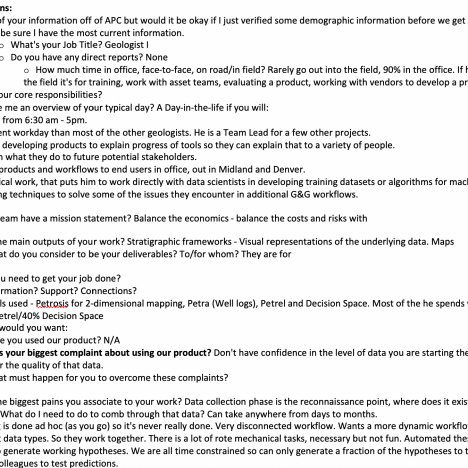
- Geologist manually pick and interpret more than 10000+ tops from well logs
- Computationally too intensive, human error while assigning tops to wells (sedimentation of minerals in the well)
- Difficulty in maintaining various versions of interpretations (Multiple areas worked by a different geologist and want to see how the interpretation of Geologist A transfer to the area worked by geologist B)
- To identify the 5% of the wells with the most uncertainty and have the best geologists focus their effort on those.
- Geologist may generate 10,000 tops in 2 months manually picking the tops
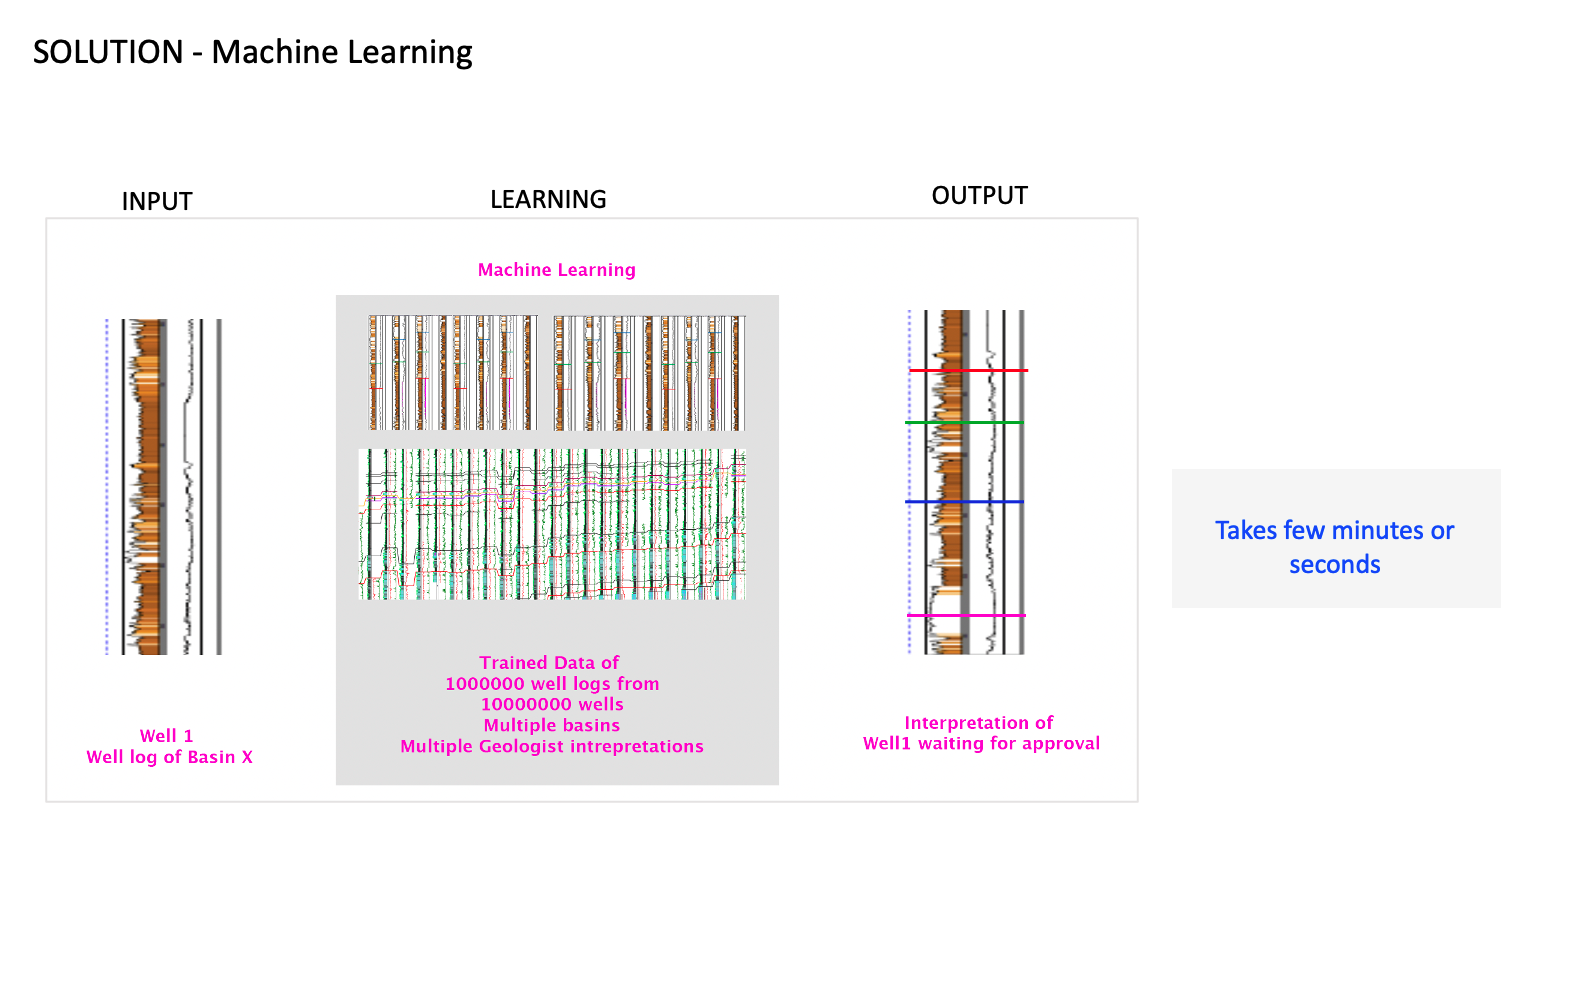
Solution (Machine Learning):
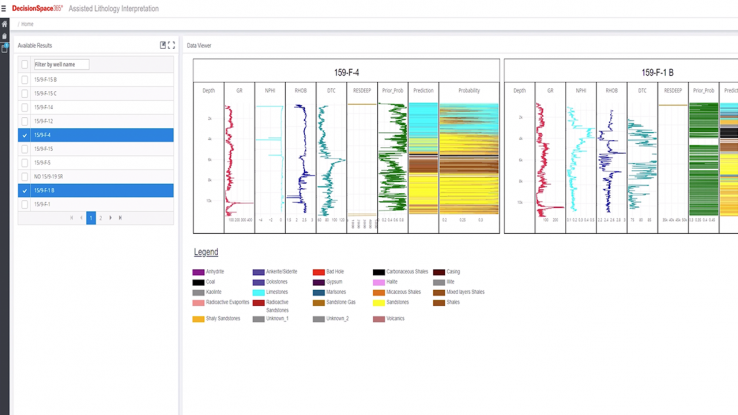
- With machine learning, Lithos provides a simpler, faster "tops" interpretation while running the data of a huge volume of well logs.
- Correlate well logs using tops from various basins, more reliable than public logs.
- Lets geologists know where to focus their efforts because it provides errors that are slightly worse than the training dataset supplied by human geologists.
- Well, log normalization by petrophysicists may be reduced.
- With machine learning 100,000 accurate tops can be generated in 6 days – corresponding to a 100X increase inefficiency.
UX Opportunities :
- Leverage the ML Solution by providing a user-friendly solution
UX Limitations:
- ML is often difficult to design with is that there is no common way to separate problems and solutions in a machine learning process. In general, the intrinsic qualities of available data anchor the capabilities and limitations of ML outputs, leaving little space for exploring design possibilities outside of the current paradigm.
User Needs Identified:
Based on User Research I identified the below top user needs-
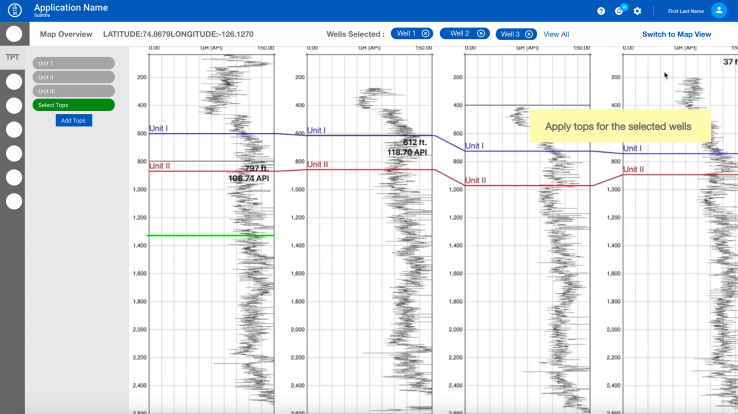
- Compare well logs
- View multiple well logs at a time
- Solution for the gaps from other tools
- Easily generate report
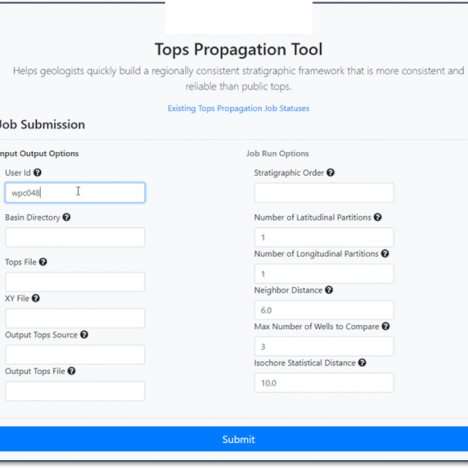
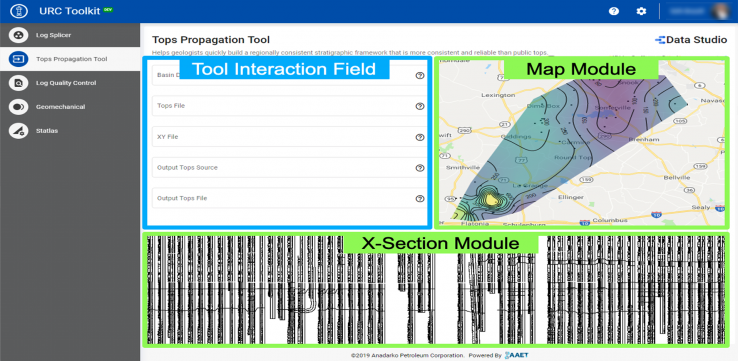
- Correlate multiple tops across thousands of wells in hours, not months
- Platform agnostic – outputs tops into any platform
- The user in control – they define how conservative or aggressive the propagation needs to be
Major features I designed :
- Interactive map-based analysis and report generation
- Performant data visualization at scale (e.g. 1k well X-sections, 100k wells mapped)
- Consistent look and feel
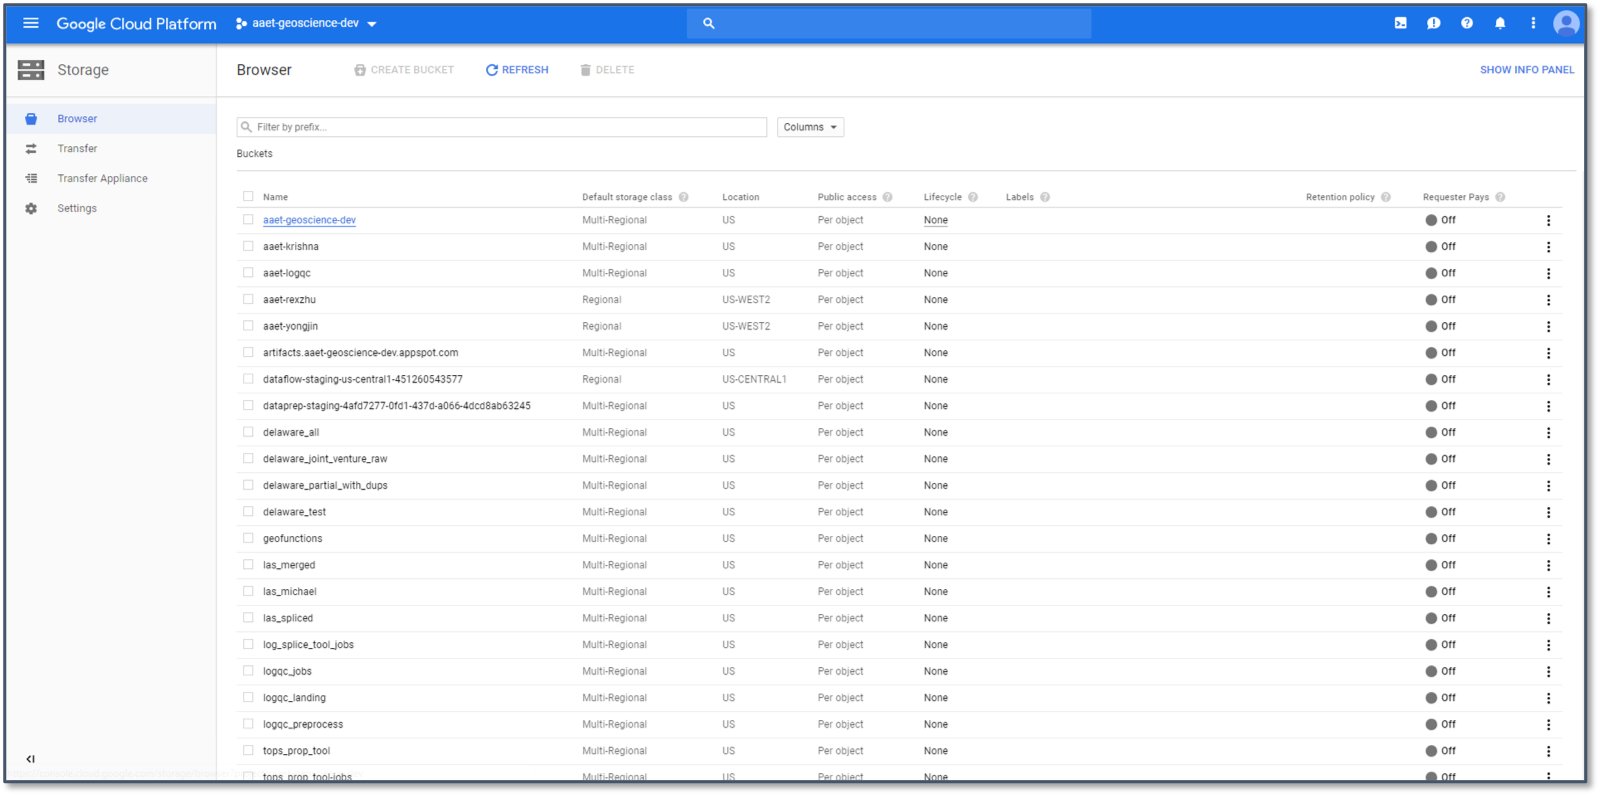
- Cloud-enabled and accessible via web browser
- Seamless flow of data between tools and easy I/O to current platforms
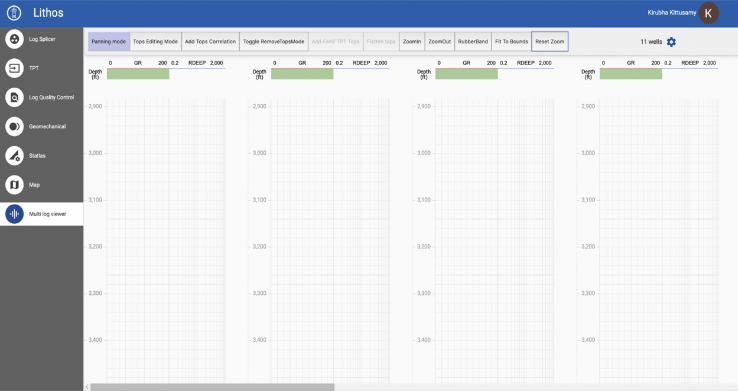
- Interactive multiple log views
- Toolbar for editing maps & logs (changes based on previous action)
Product Design Process
While it is impossible to have a universal design process that can fit all projects, here is a general flow of the product design process I followed.
Vision & Strategy
Kickoff Meeting
Requirement Gathering
Stakeholders Identified
Product Research
User Research
Competitor Analysis
Walkthrough of existing applications
User Analysis
Proto Persona
Primary Persona
Secondary Persona
Ideation
Journey Mapping Workshop
Scenarios
UI Concept to show the big picture
Design
Wireframes
Interactive prototype
UI artifacts
Visual Design
Scrum Team - UX stories
Testing & Launch
UX Review
Launch
Product Research
As part of the product research I did : User Research, Competitor Analysis and Walkthrough of current applications
Why I did User Research?
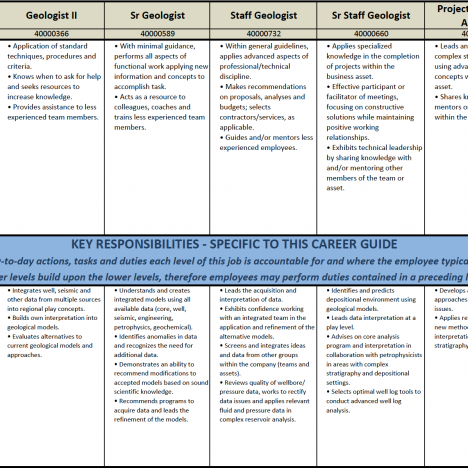
Even though the target audience was specified as Geologist and Petrophysist by the business, when I looked at their profile in detail, their tasks and responsibilities overlapped with other Engineers. To narrow down the target audience and to understand their mental model and behavior, I did user research. I was able to collect the user profiles from various sources such as the Resource management team, Project Managers, and Product owners. I picked geologists and Petrophyscit profiles to analyze such that I could make a list of user-profiles targeted for this project.
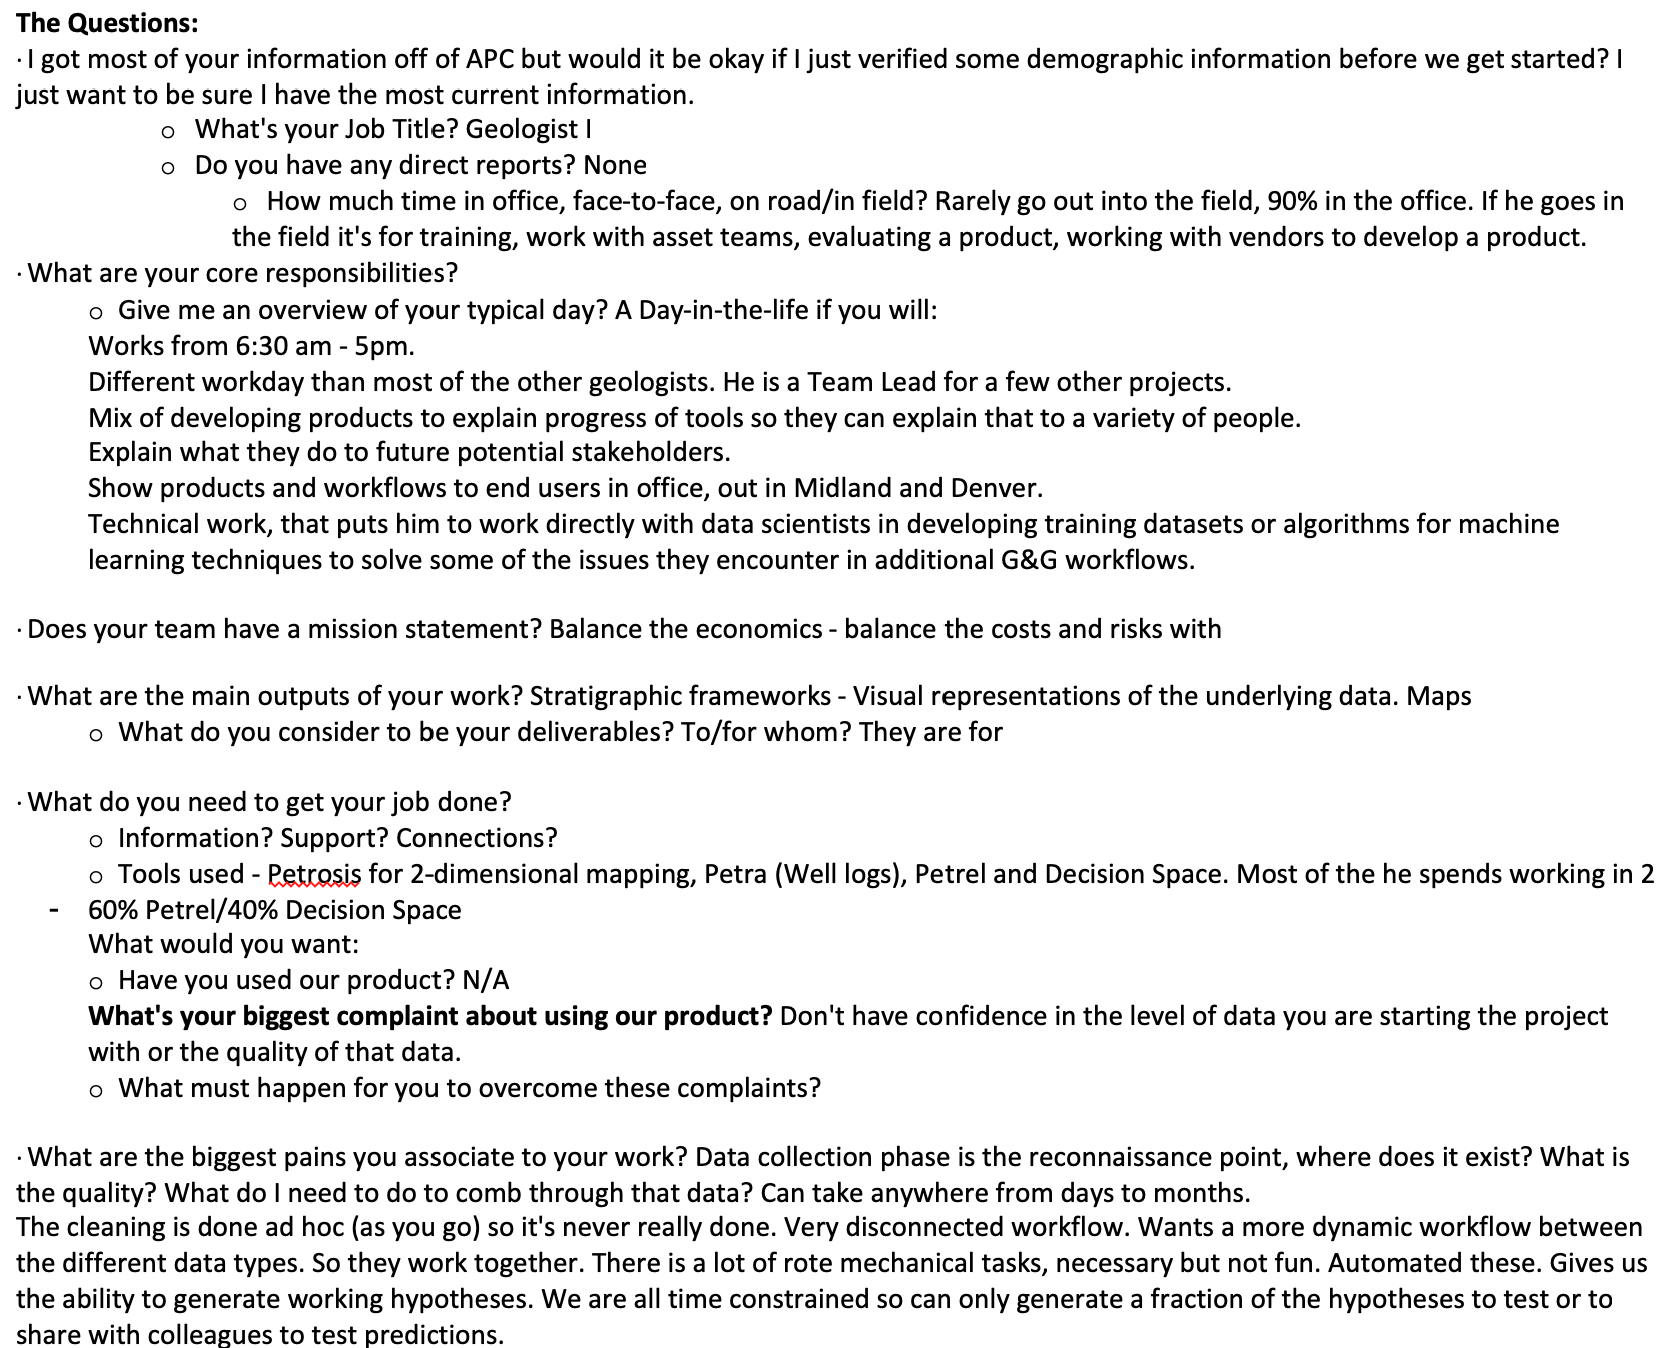
With the help of the Product Managers, 12 Users were identified and 5 users were interviewed. I interviewed Geologists, Petrophysicist, Geophysicists of various levels. They range from less experience to experts in the field - Staff, Managers, and Super Users.

Insights
Some of the user insights discovered as part of the research are :
- Their tasks overlap with others - a Geologist may also perform a petrophysicist or other engineers tasks in some cases.
- They are domain experts and have a lot of jargon to be understood by junior geologists.
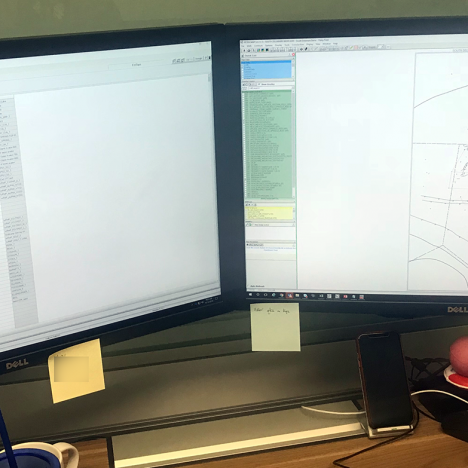
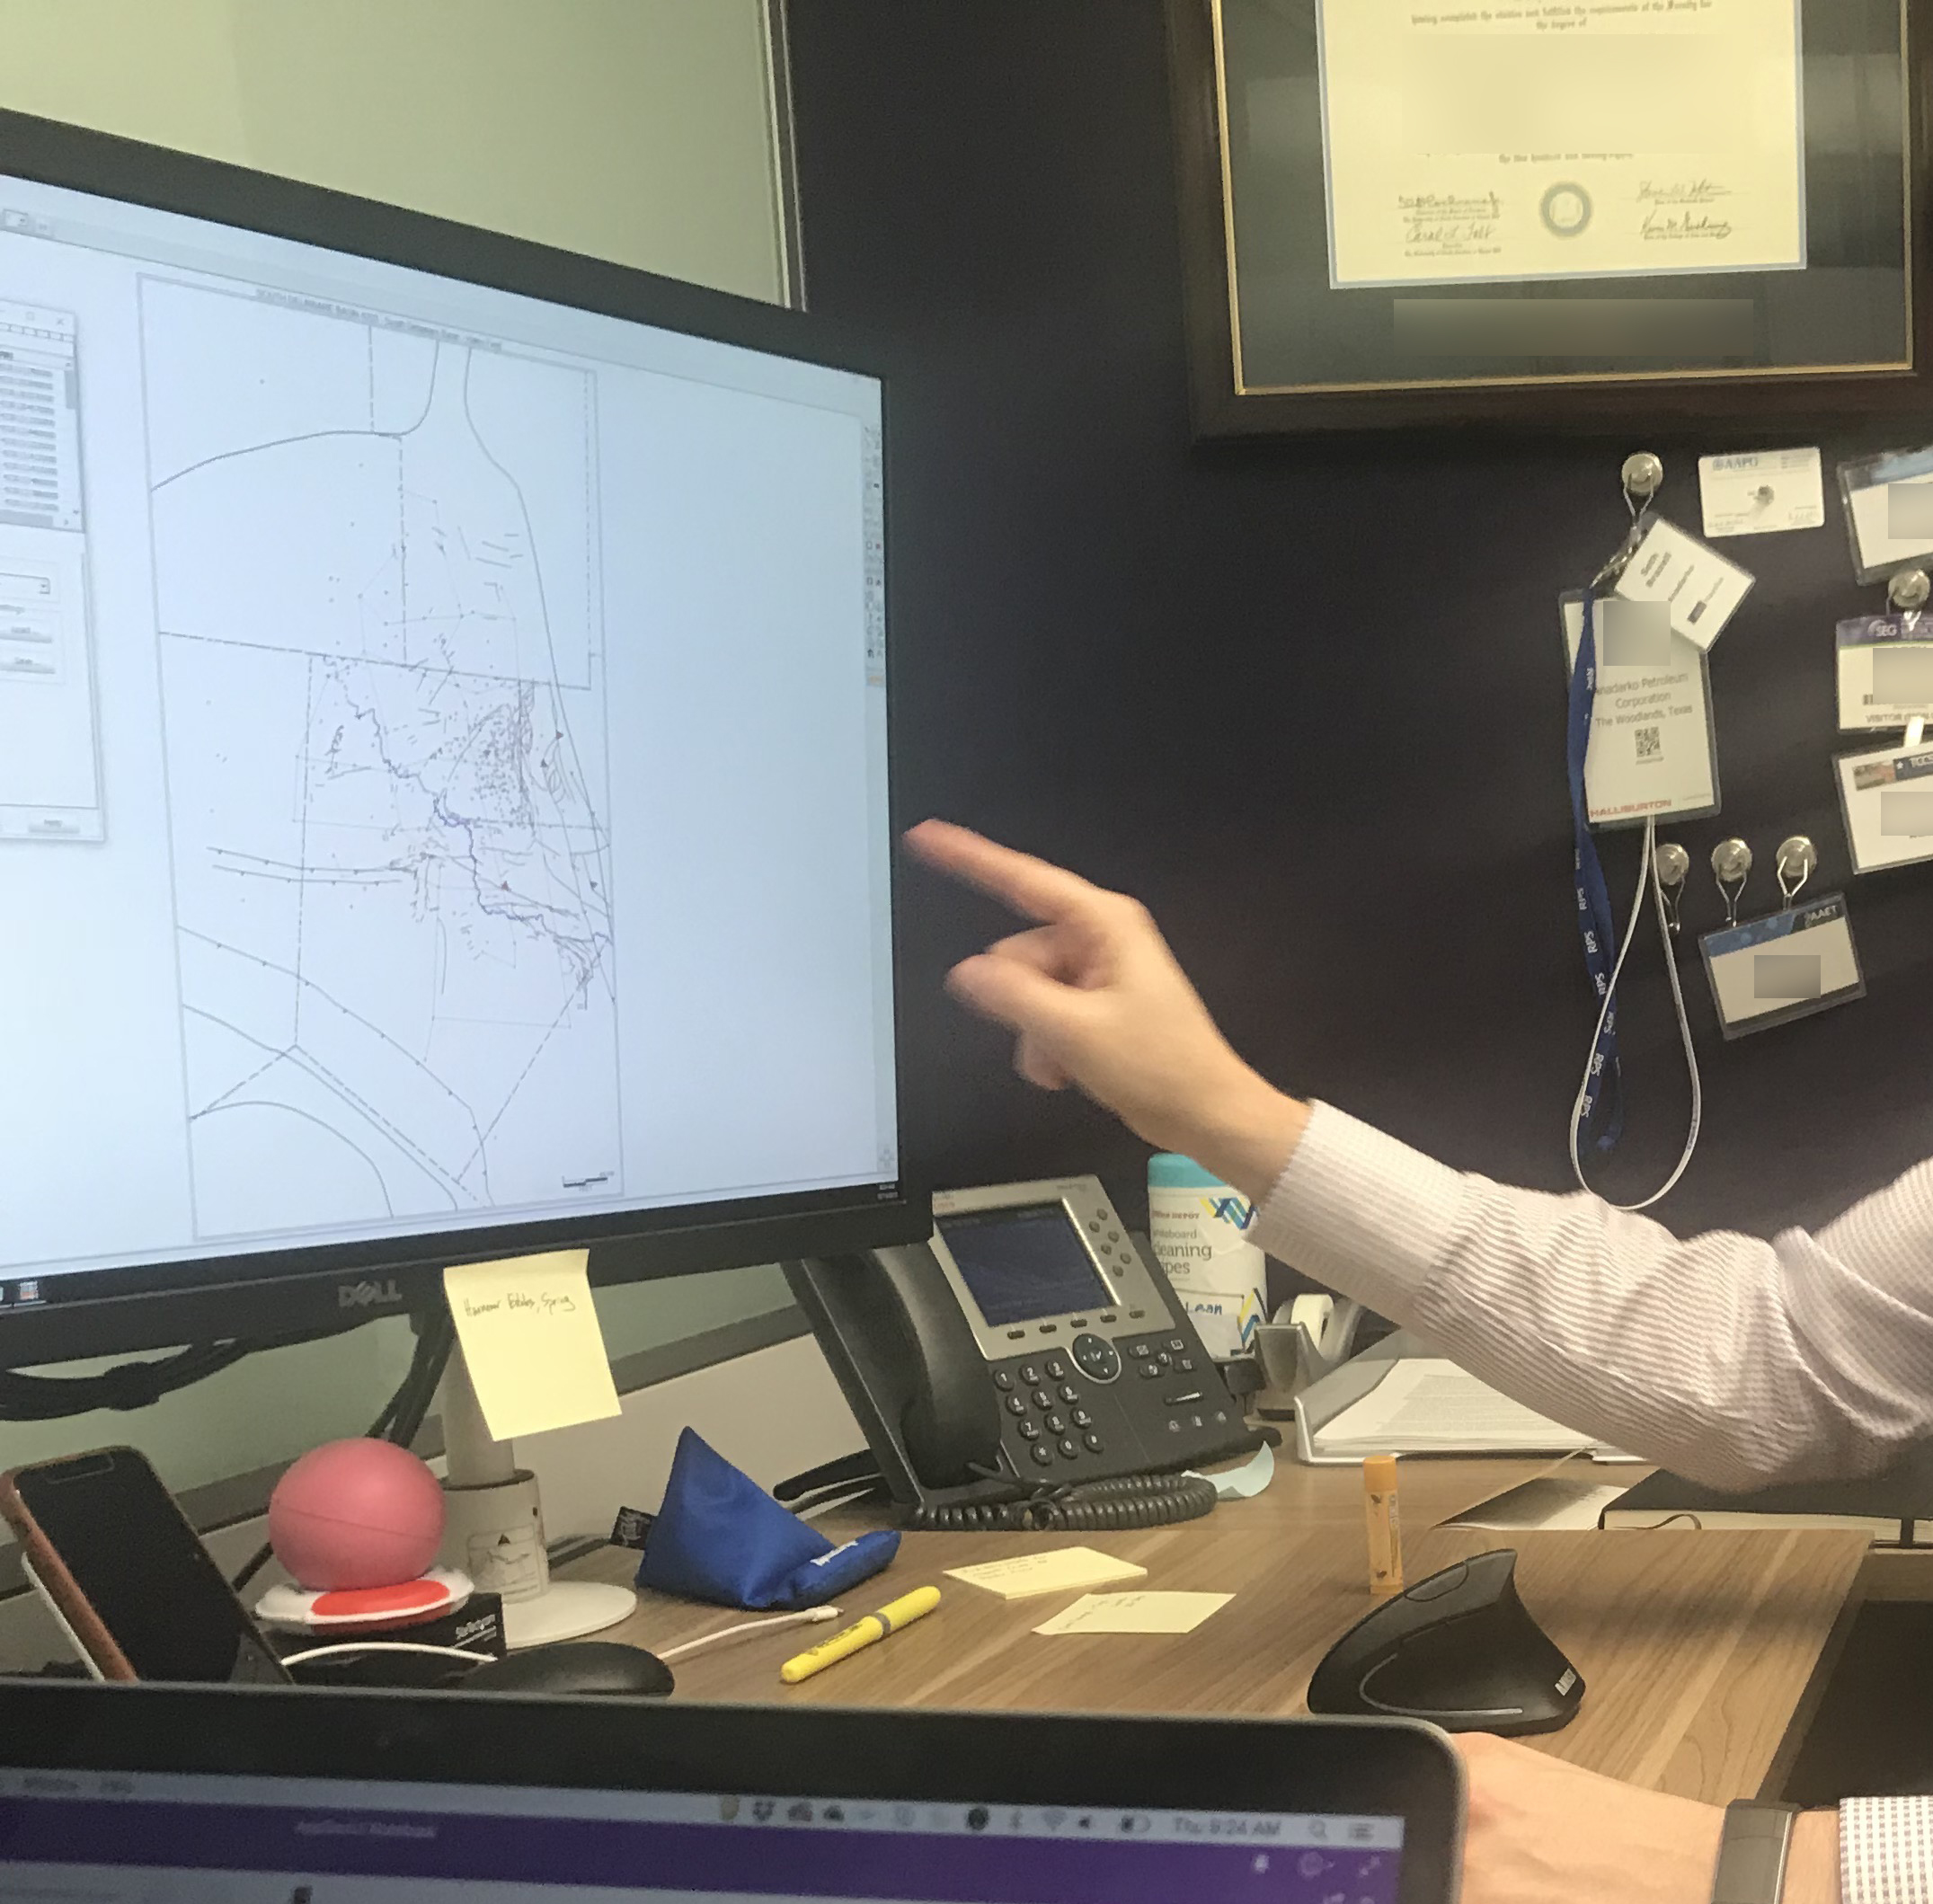
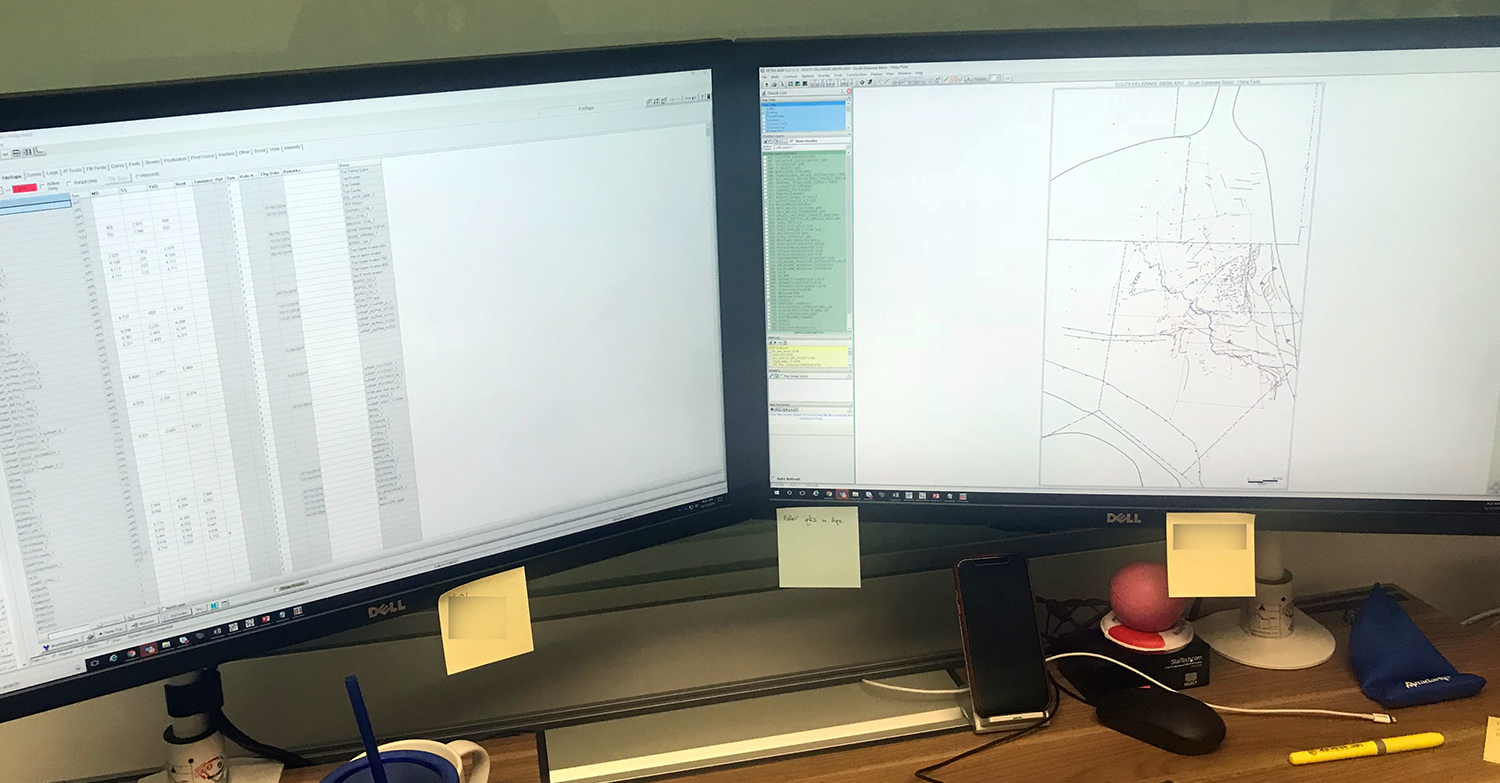
- They use dual monitors or more, their screens can be stretched to two monitors.
- They deal with a huge volume of data at a given time.
- They multitask for analysis, Their analysis can happen over a year.
- They use various analysis tools and generate a report to present them to peers and managers.
Why I did Competitor Analysis?
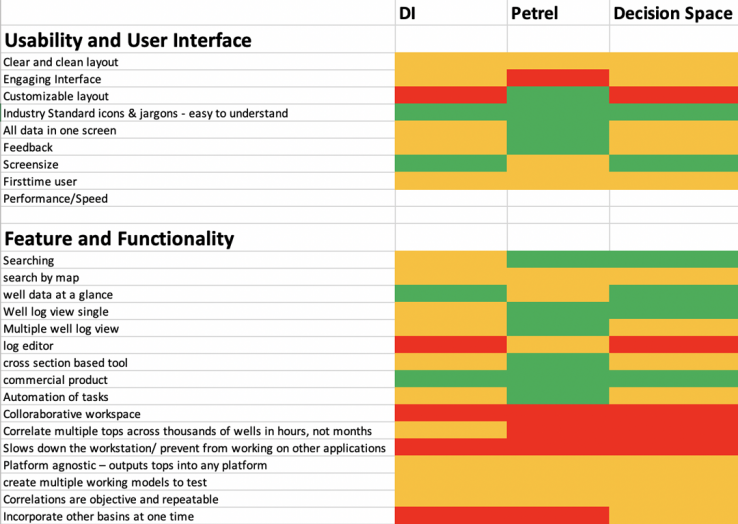
The Product owners have already done a competitor analysis in terms of geological data analysis, however, there wasn't much of a User experience factor considered in their analysis. To uncover the user experience features from the competitor tools I reviewed a list of competitor tools.
I found that each tool is for specific usage and the similar functionalities among all the tools are very few. This way having a common list of features for a competitor analysis focusing on user experience was challenging. So I listed the features which the product owners would want in the "to be" application for this exercise.
Features and Functionalities identified during competitor analysis also became user stories.
Competitor Applications
Insights
Some of the insights discovered while understanding the competitor applications :
- There are gaps in the competitor tools which is important for the current users.
- They switch to other applications to fulfill the gap.
- Current users have created separate small applications for the gaps they have identified.
- Current users will be happy and expect to have an application without the gaps which will save a lot of time. - for example, to run multiple logs it takes more hours or even days to run the logs, the users use another application to run the log. Then in another application, they edit the log, and another application to generate reports with various outputs.
- All they have is a desktop-based application, current users expectation are to have a cloud-based application deployed anywhere
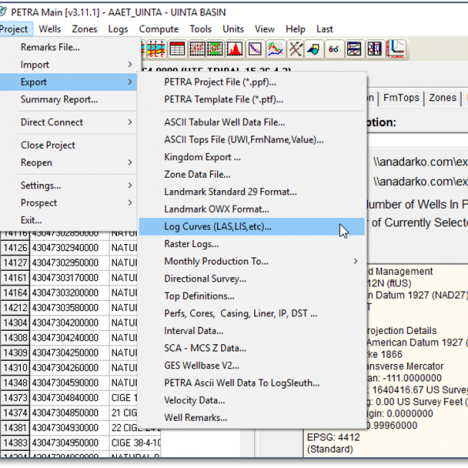
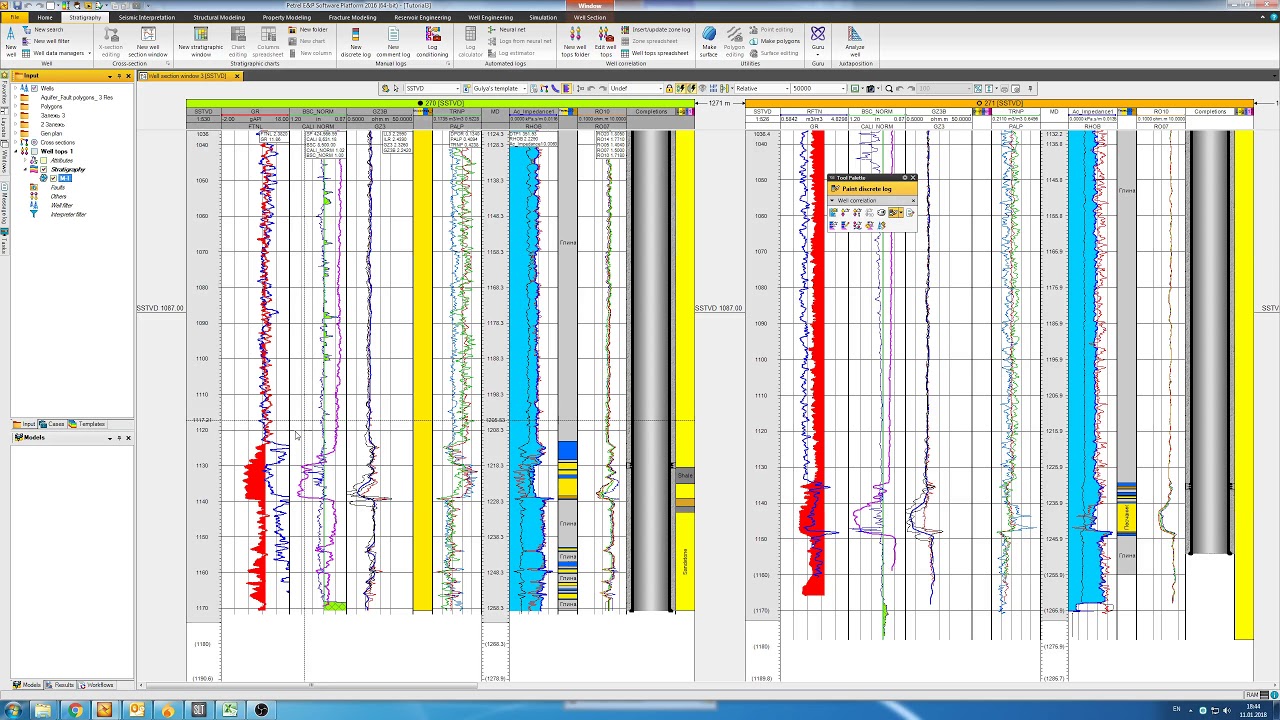
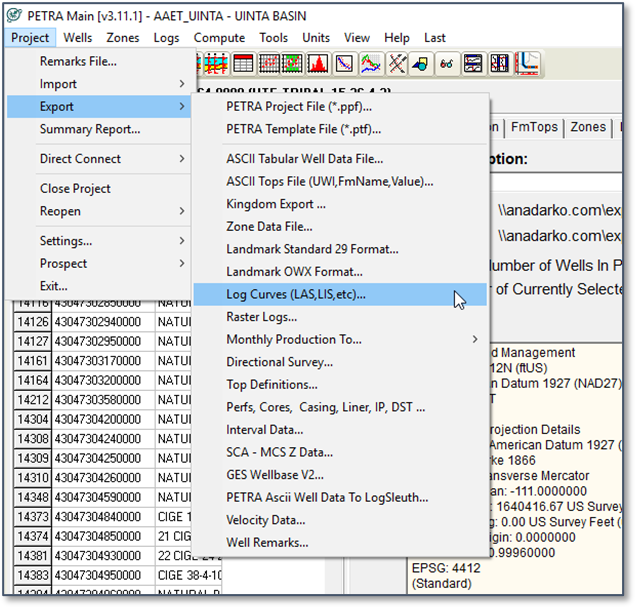
Why I did Current Status of Applications - Walkthrough?
One of the ways to learn the domain and the business requirements is to study the current status, this will guide me to take it further and help me as a talking point with various stakeholders. To understand usability problems and the current user experience it is best to understand the as-is or relevant applications.
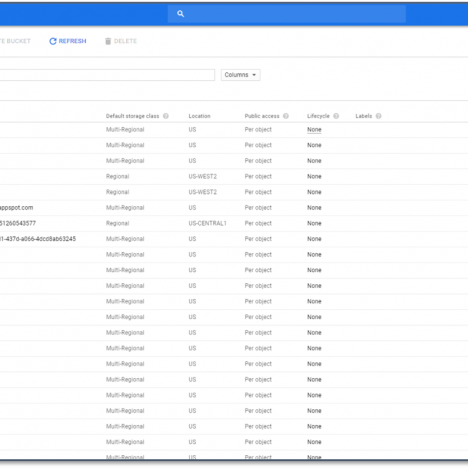
Insights
Some of the insights discovered while understanding the current applications :
- There were no solutions/ applications for maps and wells.
- Some of the solutions don't have a UI, it is run on python or other tools to produce the output.
- The As-is applications don't follow brand guidelines or they are consistent with other products.
- Each of the applications were designed by developers for ad hoc solutions and lacks a good user experience.
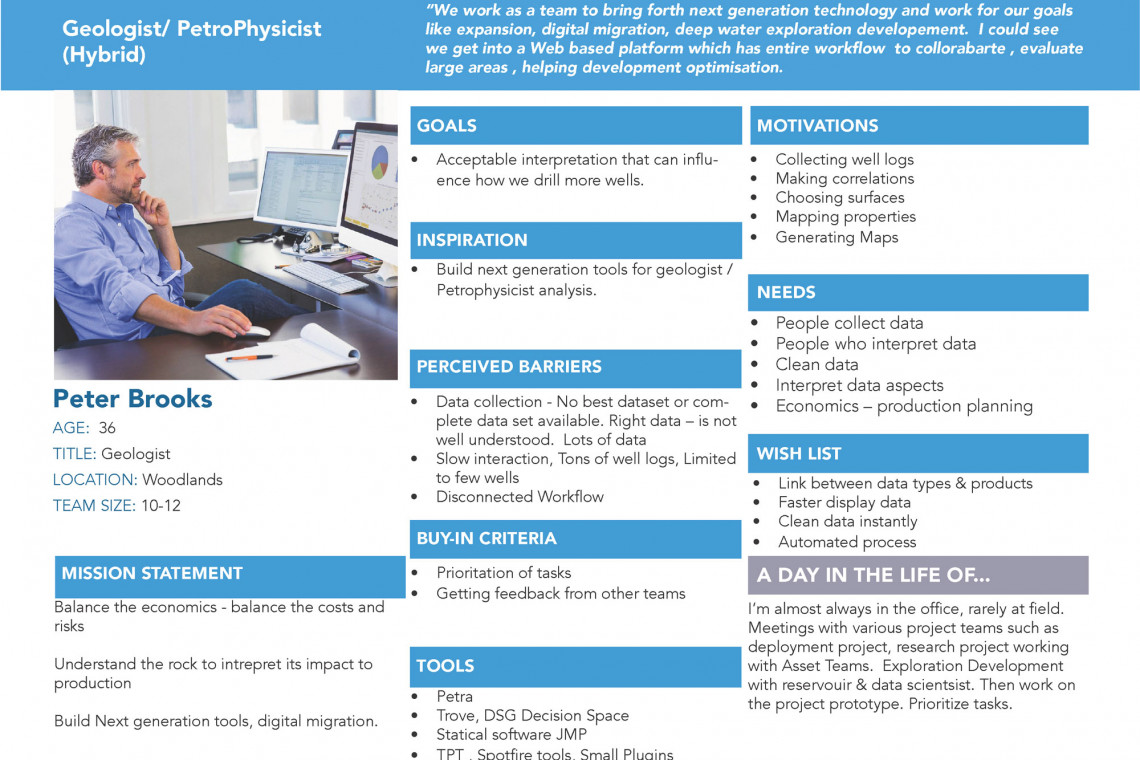
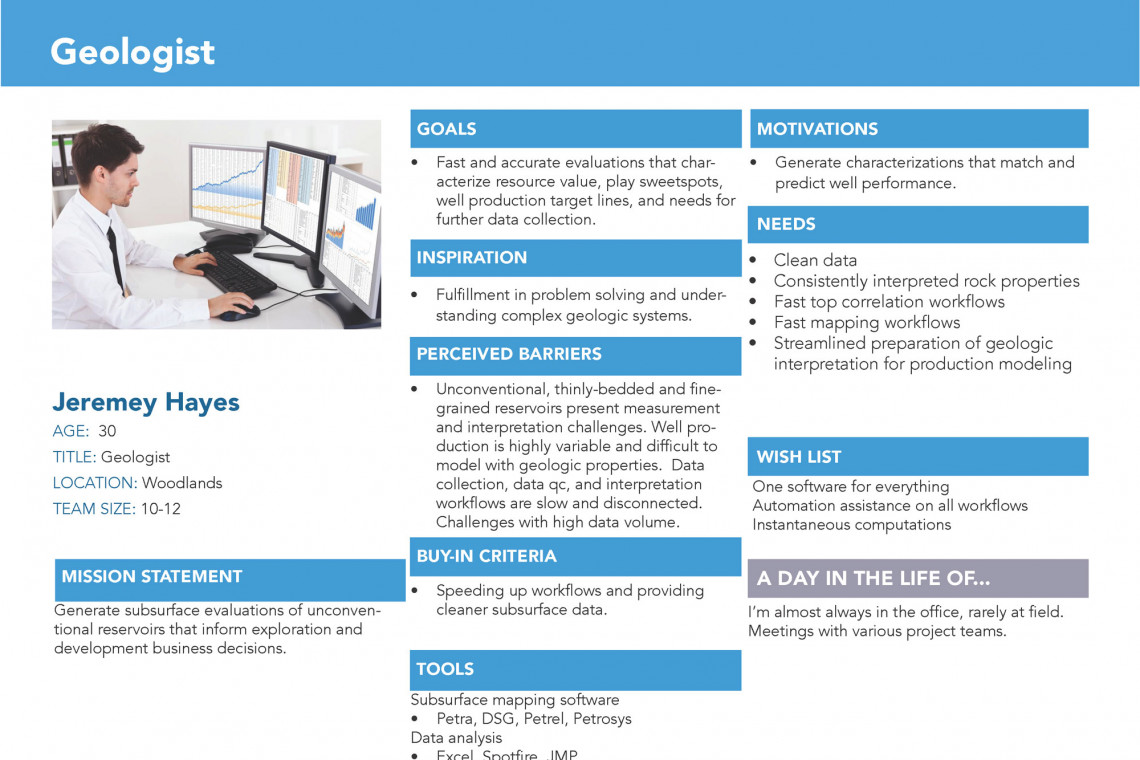
User Analysis
Proto Persona, Primary & Secondary Persona
Persona
Eventhough both the personas have similar features one was a hybrid of both of them. Also, there were user roles in the application where only a part of the application was accessible by the user. We still didn't explore that part of the persona, which I planned to do it as the project progresses and update the personas.


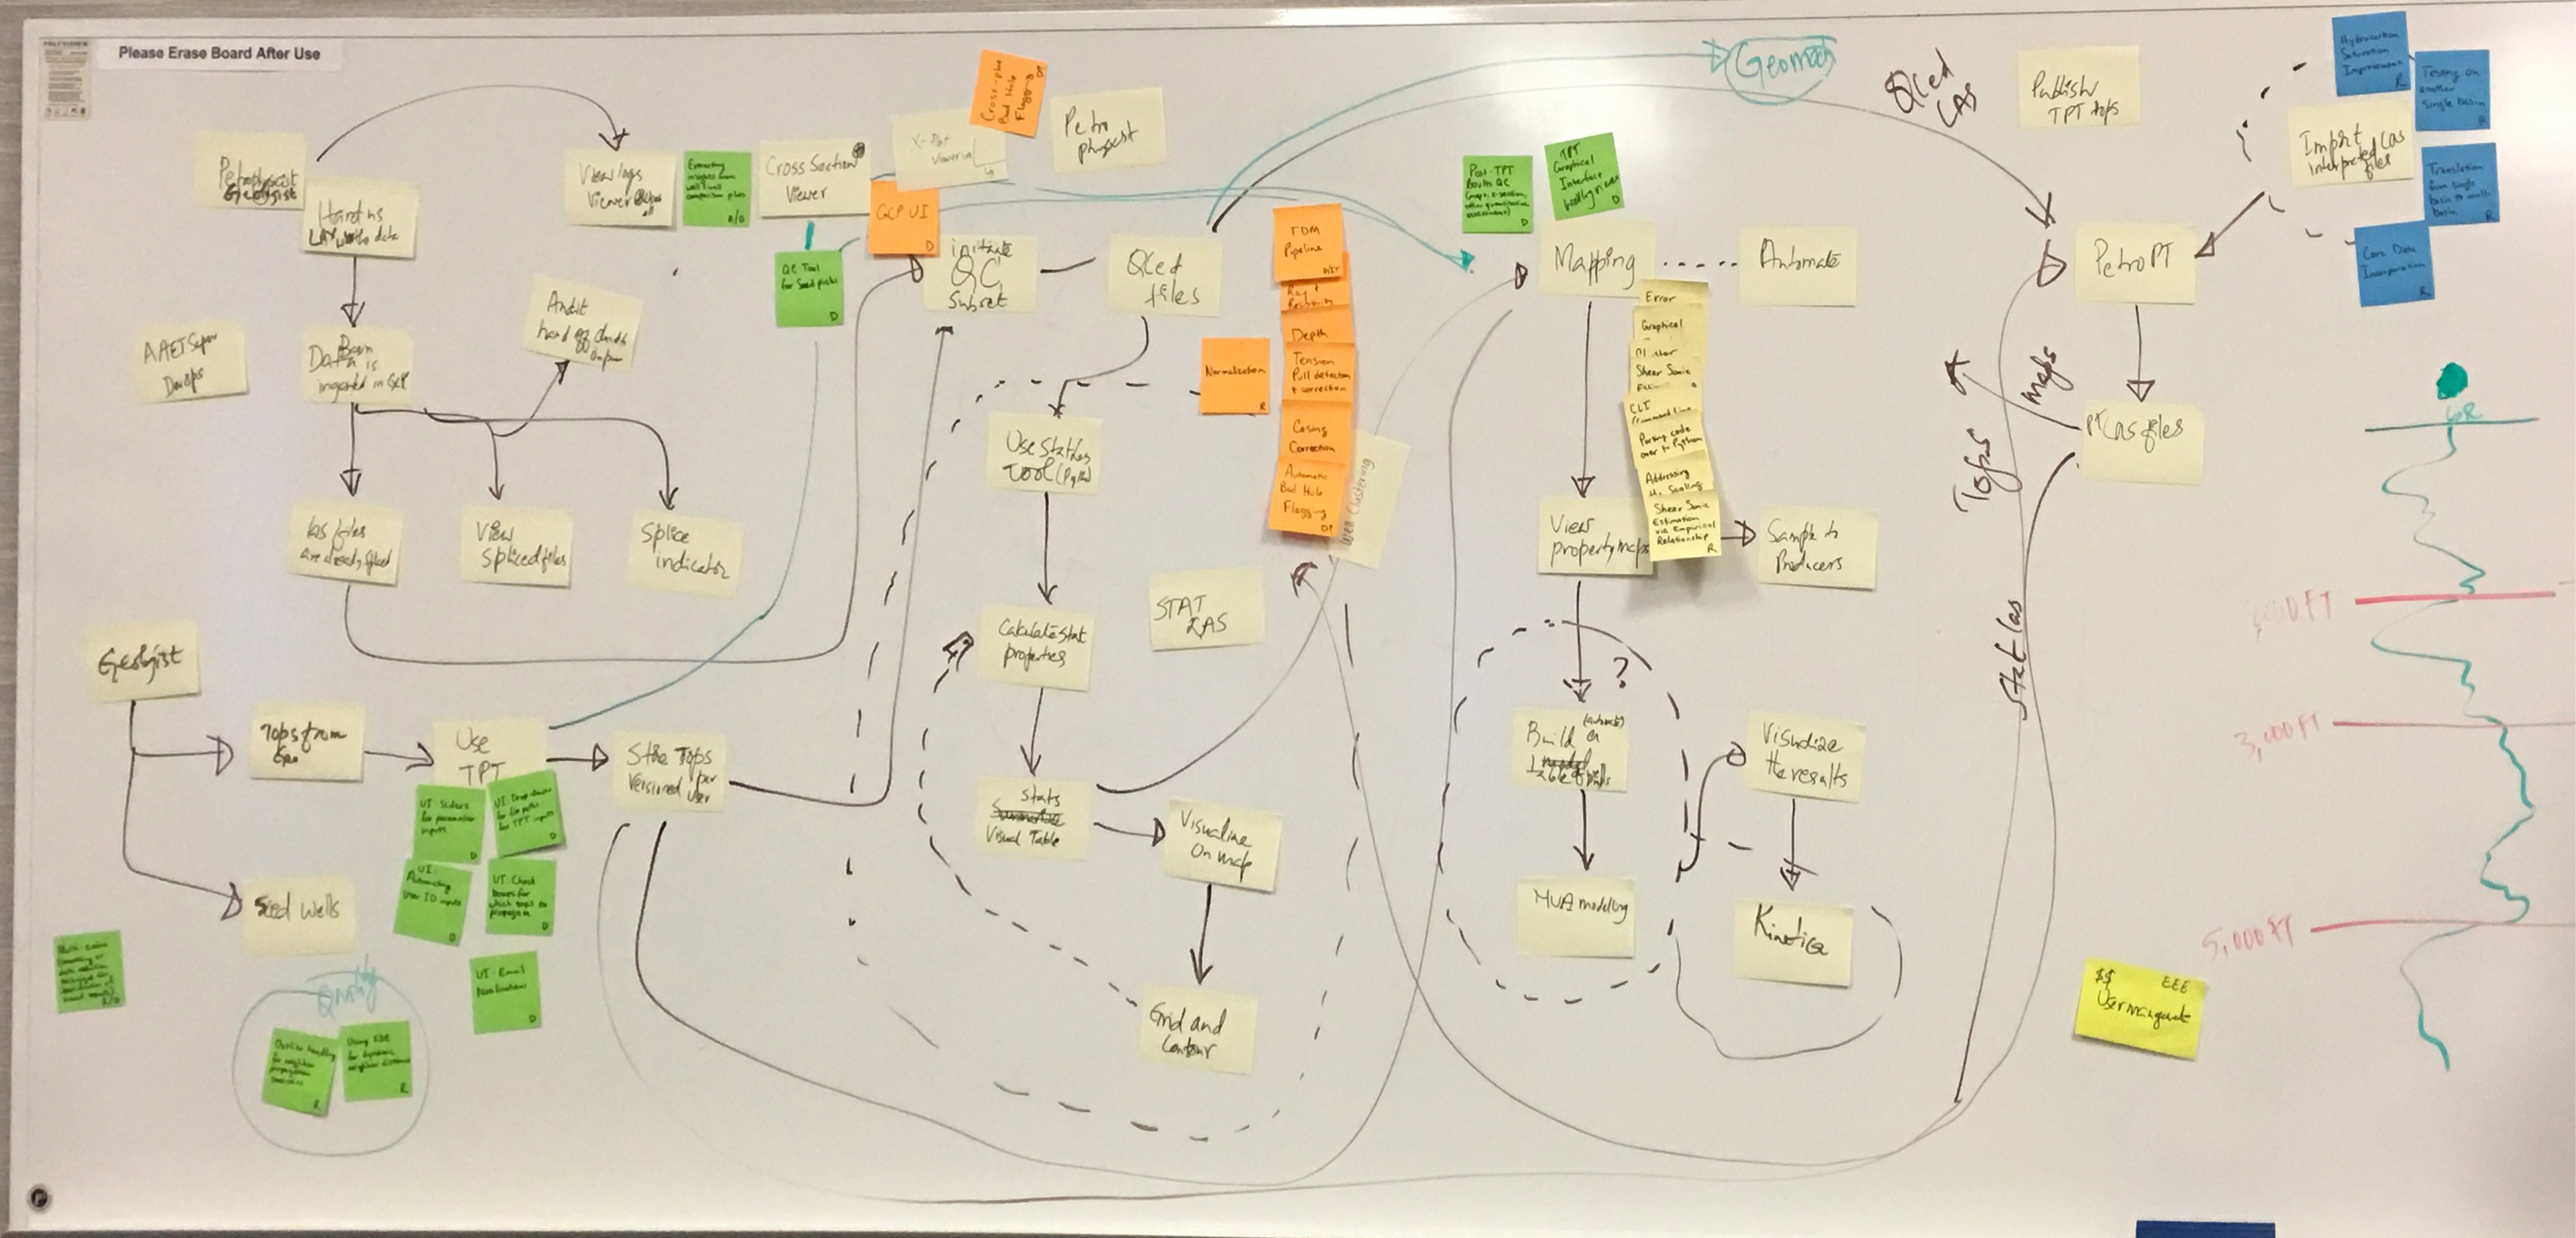
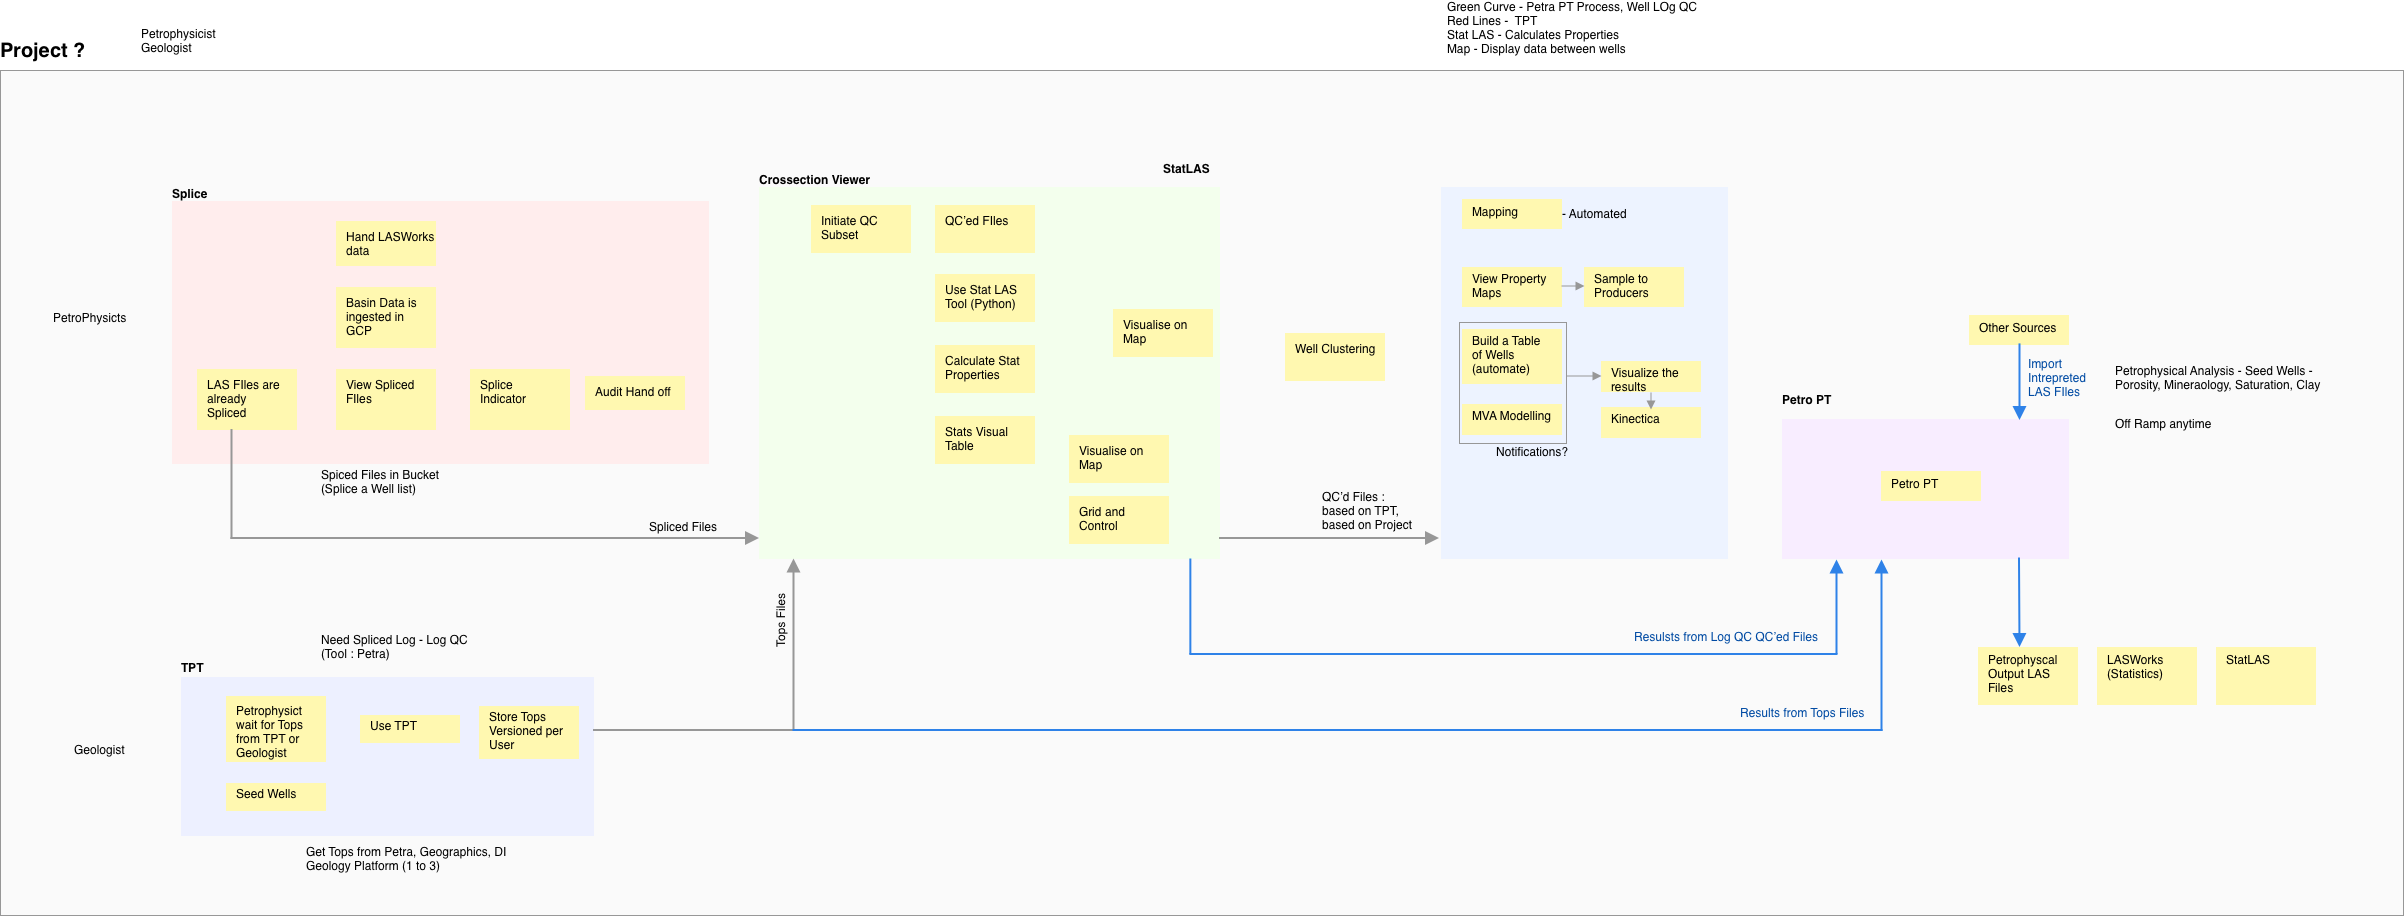
Journey Map & Workshop
With the large group of stakeholders having them interviewed each one separately gave some user insights also we needed a collective requirements gathering from about 5 groups of Internal stakeholders and 2 groups of external stakeholders with vendors from Maplarge & INT. I led the UX effort during the workshop with the stakeholders producing Journey Mapping Flow, Identified various Scenarios and workflows, Created Initial Concepts - UI to show the big picture.

Insights
Some of the user insights discovered as part of the journey mapping exercise are :
- Users' end goal is to look at the maps and well logs side by side.
- Whatever their tasks are they go to the well log to see what is updated, or reference the map in other applications.
- Gaps identified to standardize the business workflow
- Pros and cons of using the vendor applications along with the design system components
- Clear user touchpoints in the product, validate the insights from user research
- Identified scenarios to be built and removed
Design System
We were building a design system, hence we had the components ready to use, I made use of the components to create hi-fidelity wireframes. Also, the Stakeholder understood better by looking at familiar components, rather than the low fidelity wireframes. Here is a case study of how we built our design system.
Problem
Split Focus: Designing Applications for Multiple Monitor Setups.
There were many problems and questions after the workshop and user research. I started to layout sketches, and gather more information and whiteboard ideas for various sections of the product. One of the main problems was identifying a layout. Split focus and multiple monitor setup was one of many problems identified and with lots of questions. Based on the user research, it is a normal behavior to work on multiple monitors for the geologist who works on a large amount of data.
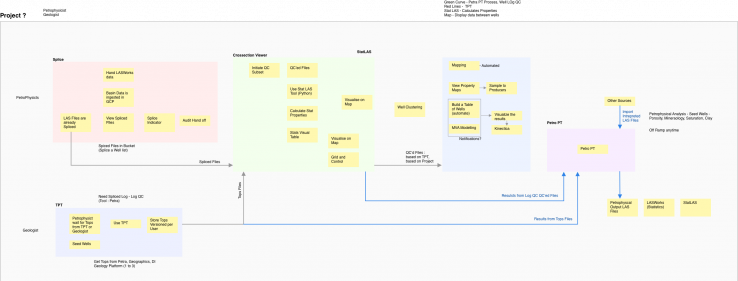
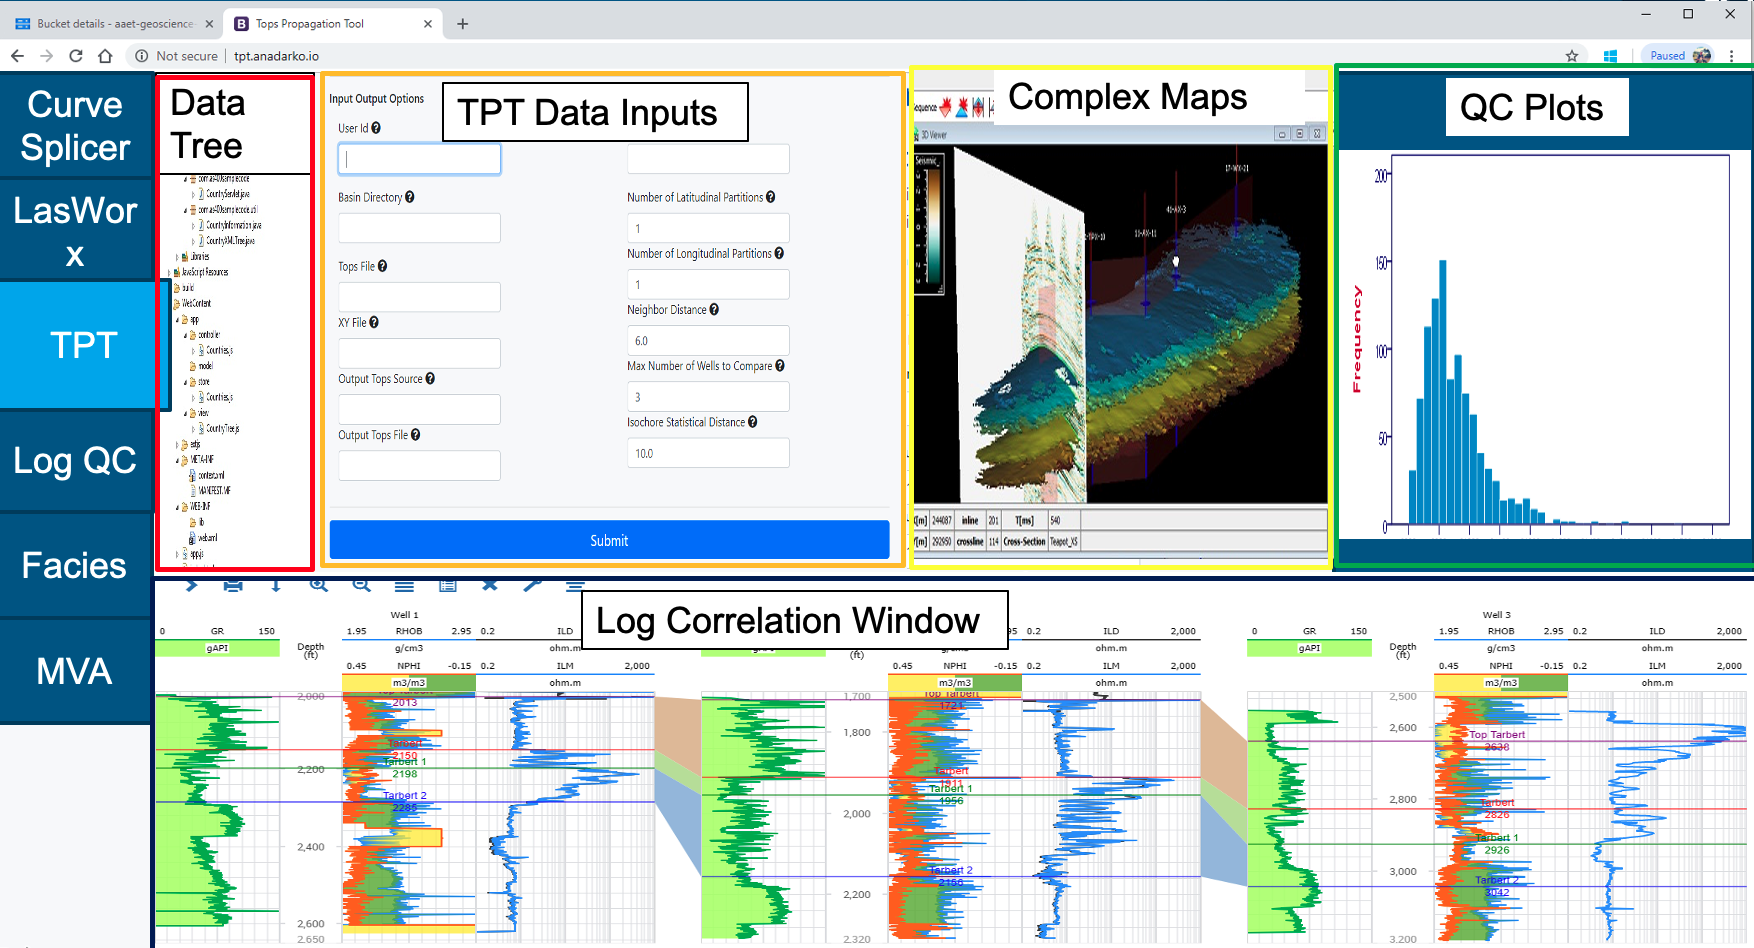
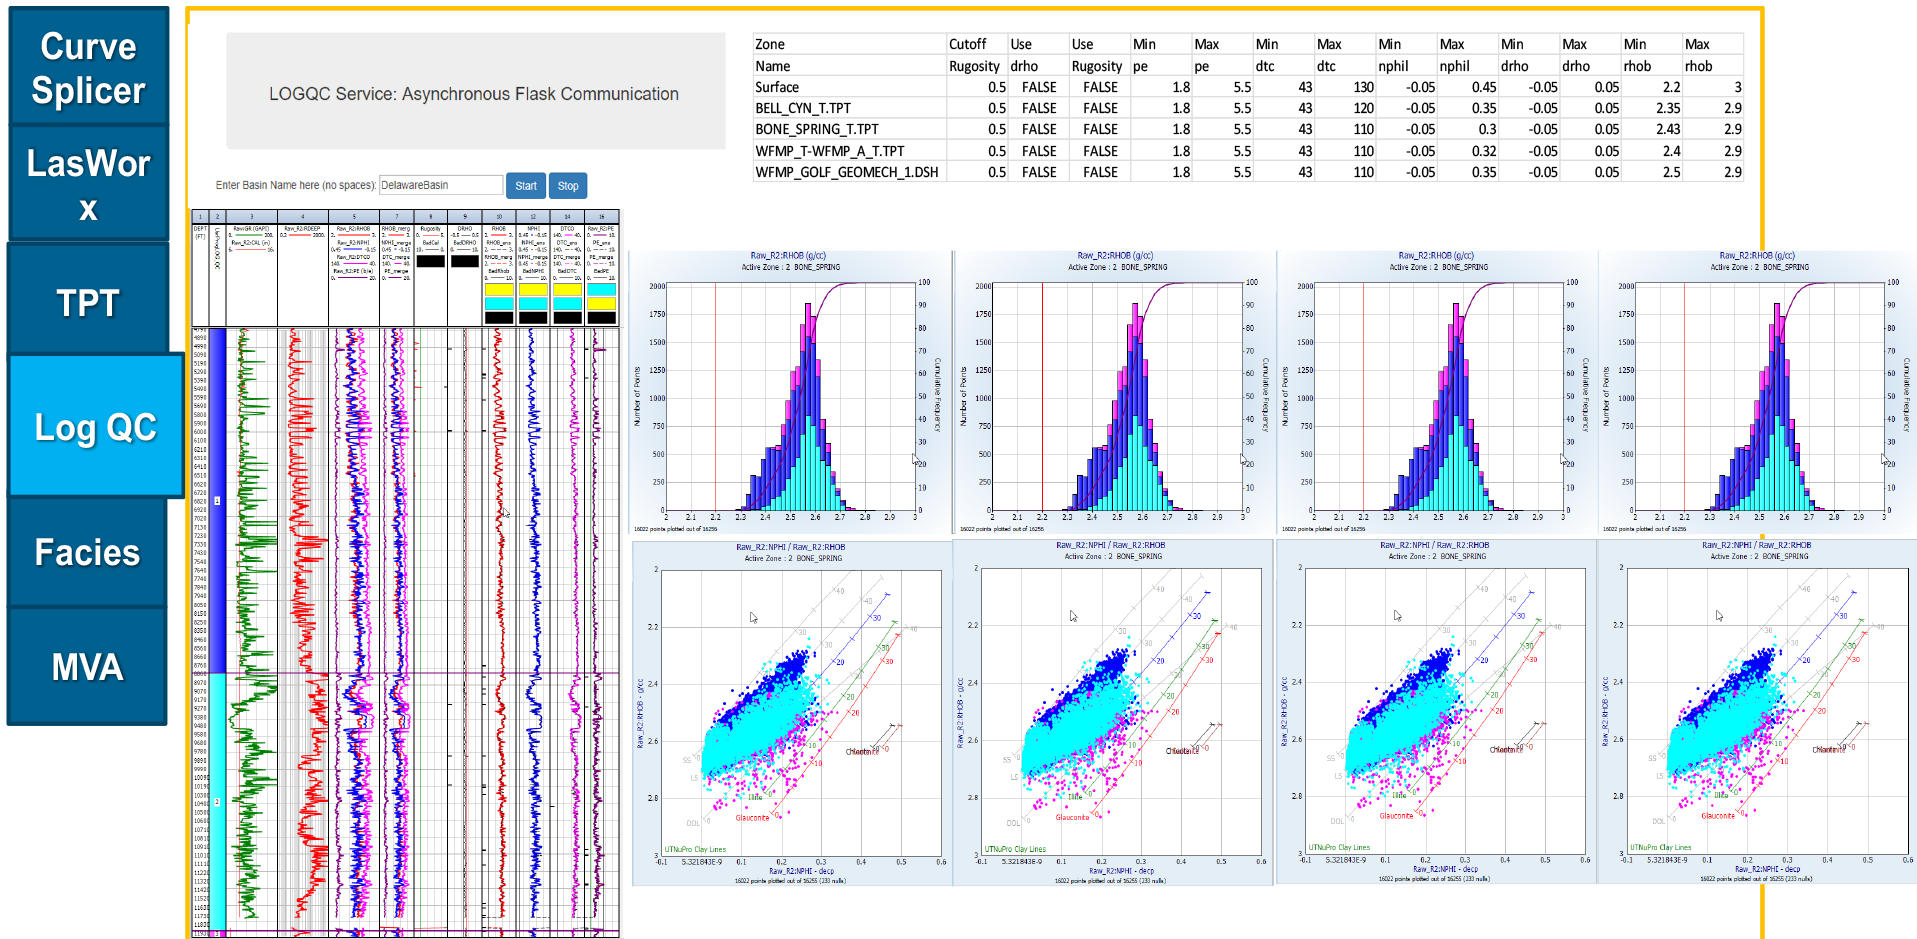
Initial Concepts # Based on the "vision" from the workshop
As part of workshops and requirement gathering, the below layouts were created. They are ad-hoc outcome of understanding and translating the users' needs whenever talking to them. Also, these layouts have a high influence on the Product Manager's vision.

Why Initial Concepts didn't work?
- Dashboard based layout was not suitable for a highly interactive "maps" requirement
- Components does not match the Design Systems & Branding guidelines
- This layout concept was futuristic for the current need
- There was Budget and time constraint to achieve this solution
Iteration 1 # Based on the existing components - Design System Adoption
Left Navigation having both Map view and Log view as separate links


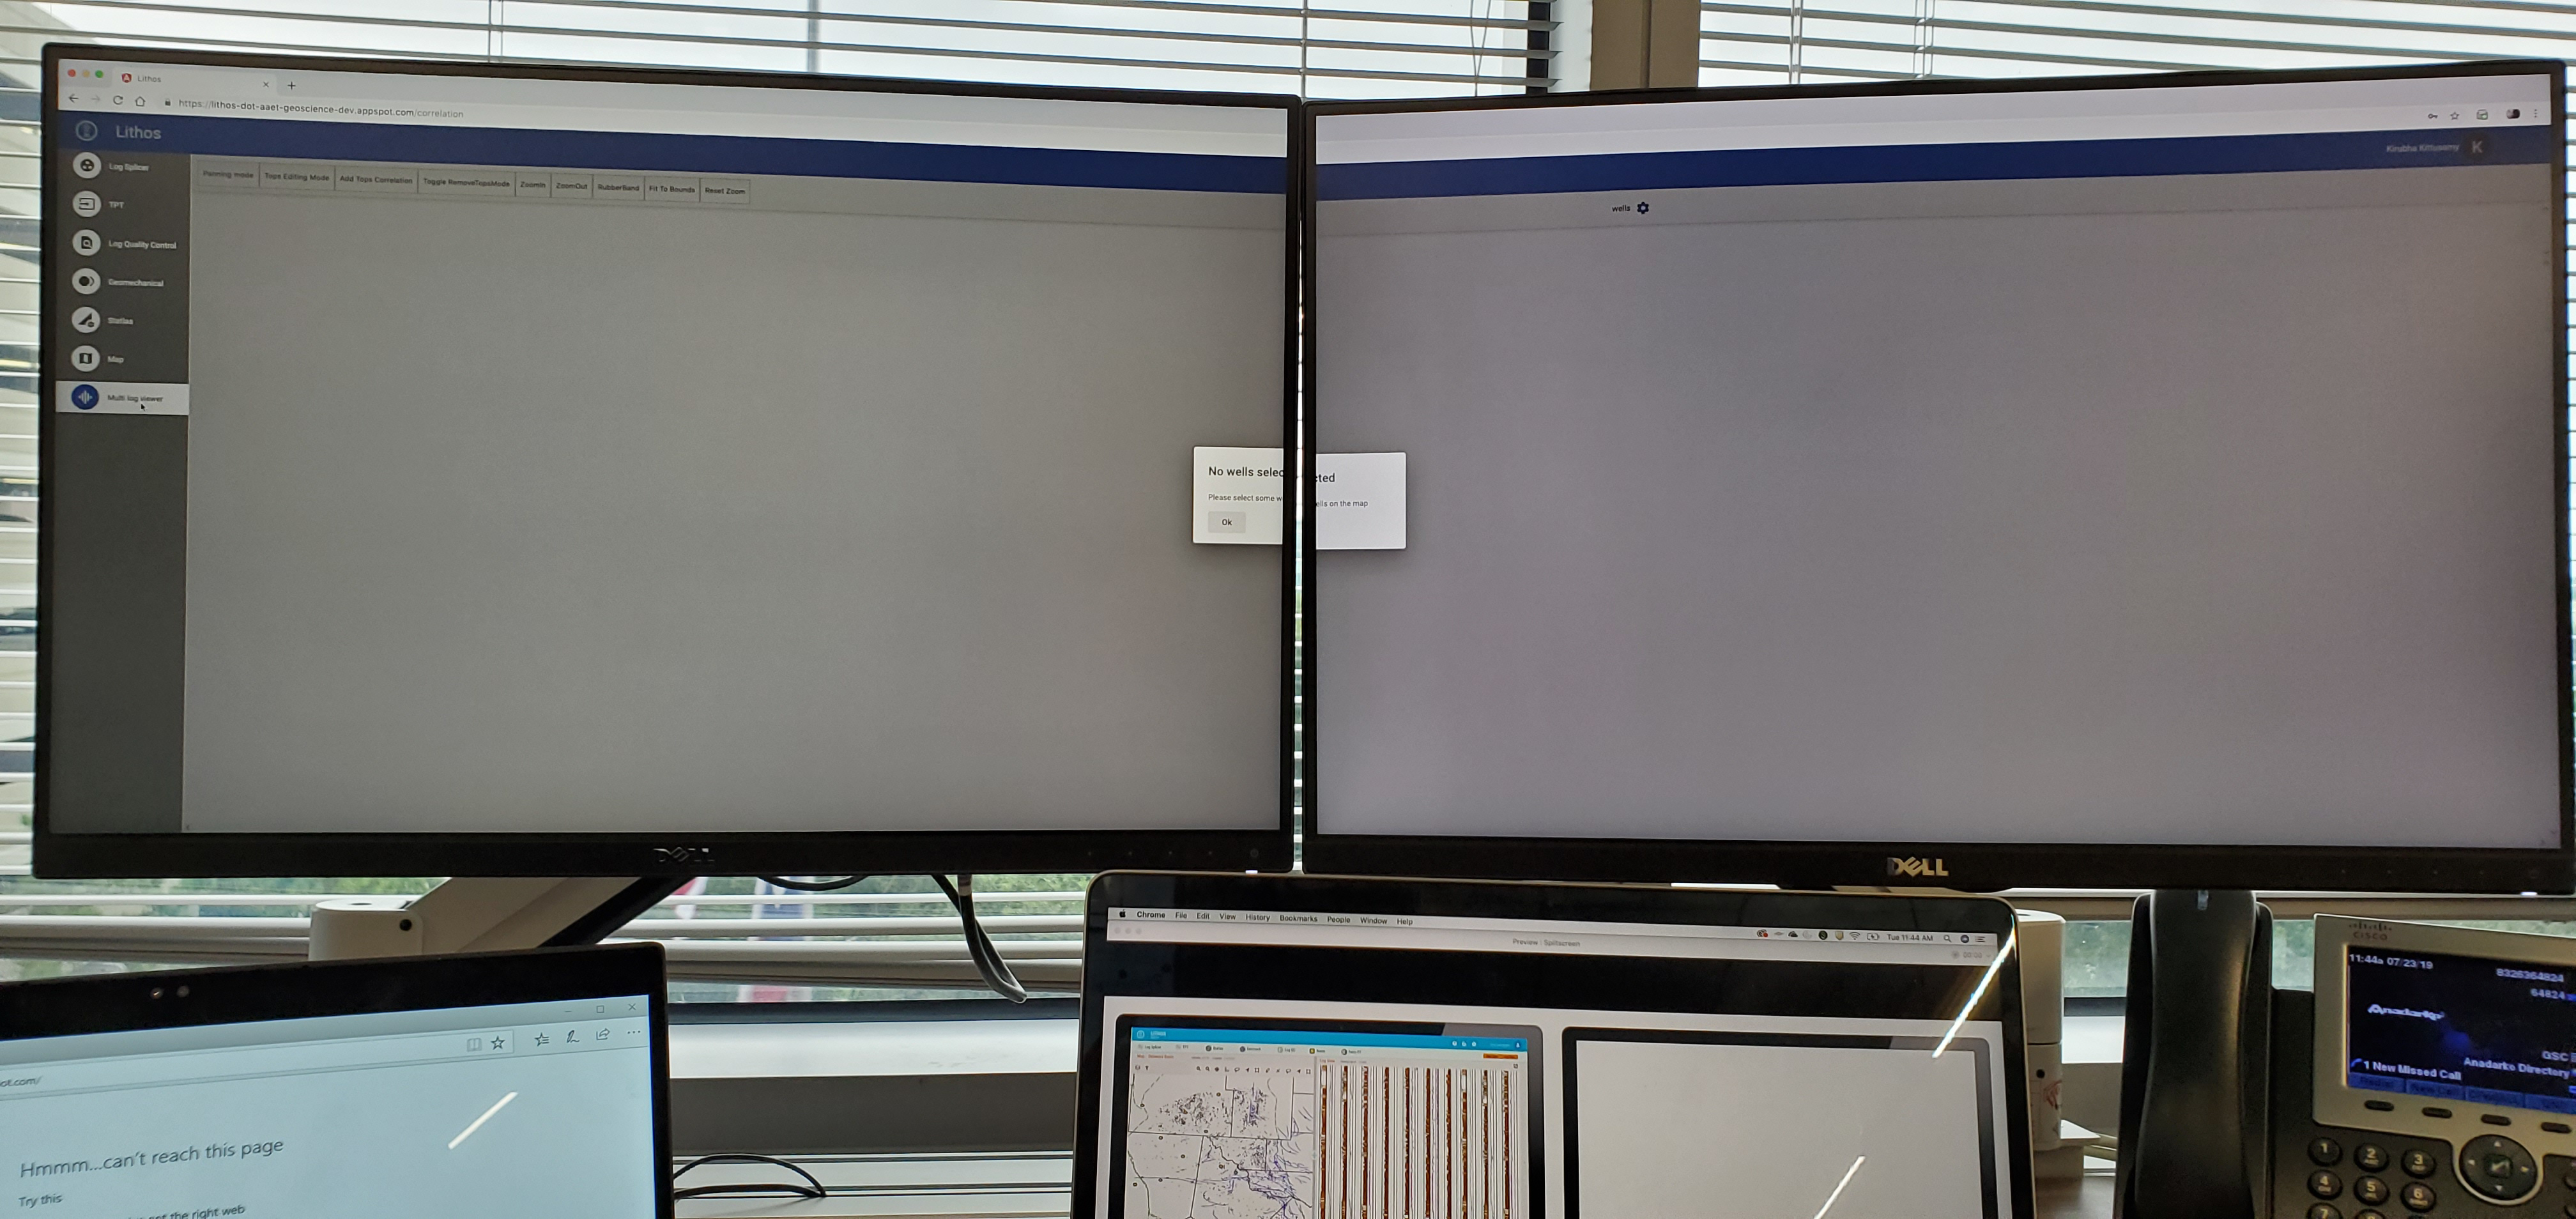
Why Iteration 1 didn't work?
Another concept which the team was trying to implement, which had a major UX problem. I understood, that the users are used to this type of problem, and they live with it. One of the users said, "I use this all the time" when we discussed on this screen. I explained to them this is a UX problem, having the screen stretched out into two monitors and having the screen cut off in the middle. This is a developer solution with the templates available and was not compatible to have maps or logs, which would communicate with each other by navigating on the left navigation panel.
Iteration 2 # Based on Stakeholder Feedback
Switch between map and log view on a single screen

Why Iteration 2 didn't work?
- Replacing the map with a log view was a technical difficultly as they both are from two different vendors.
- In the same instance, both map and the log view will be working, which slows down the system.
- Left navigation occupies more space, which has to be used for the main purpose of the tool - to view and edit maps & logs.
- Keeping the nav on the left side does not provide a focus for the user on the main task.
Iteration 3 # Based on Usability Testing with End Users
Split view for Map & Log on a single screen
Split view for Map & Log on a single screen
Why Iteration 3 didn't work?
- Compatibility is an issue -The view looked good on a desktop, but on a laptop, while looking at loads of information was difficult.
- Users have to open two windows and enter URL, to see it in two monitors. This lost the communication between two windows.
- Loading a huge volume of data in frames was making the system slow.
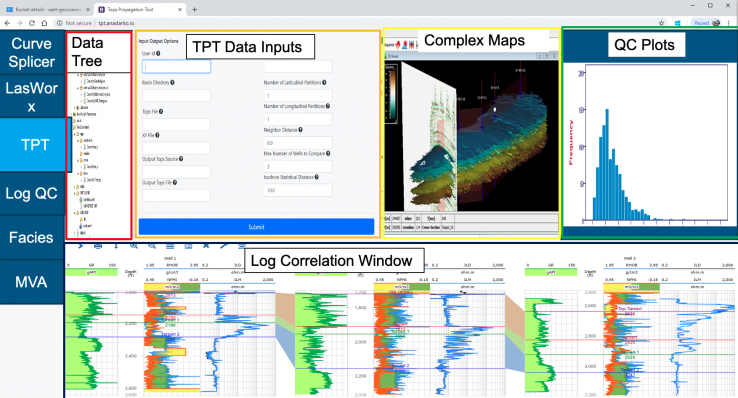
Final Solution
After many iterations and review of the various options, we narrowed down to have the global navigation on the top level, and the second monitor will not have a global navigation. This way even when the user is working on a single monitor they will be able to access the second screen as a pop-up. When they are on a dual monitor, the popup will open in the second monitor.
“We see the big picture now !
“Kirubha came up with this concept of the maps & logs put together, Now we are able to see the big picture, we can visualise what we want ”
Lithos Stakeholder
Design
When we had the initial concepts, the team had an idea of the big picture. A SCRUM team was formed and as part of the SCRUM rituals and daily standup, I provided them with wireframes and flows for the user stories.
As part of the detailed design exercise, my involvement was valued by the Scrum Team, creating UX user stories with Scrum master & Product owner, brainstorming, whiteboarding, and Creating sketches, wireframes, interactive prototype, video demo of complex interactions UI artifacts, icons, images for the development team
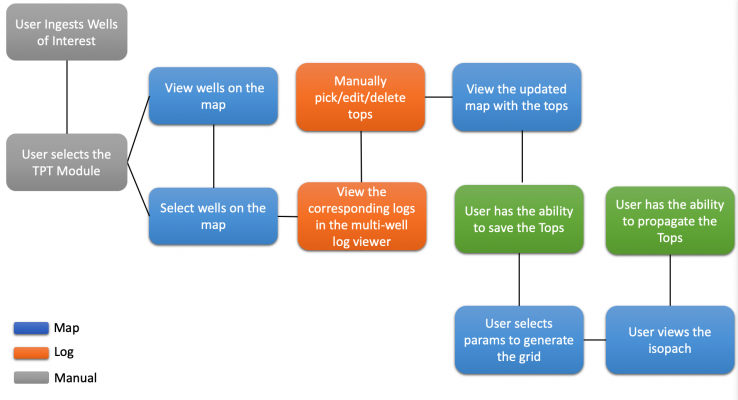
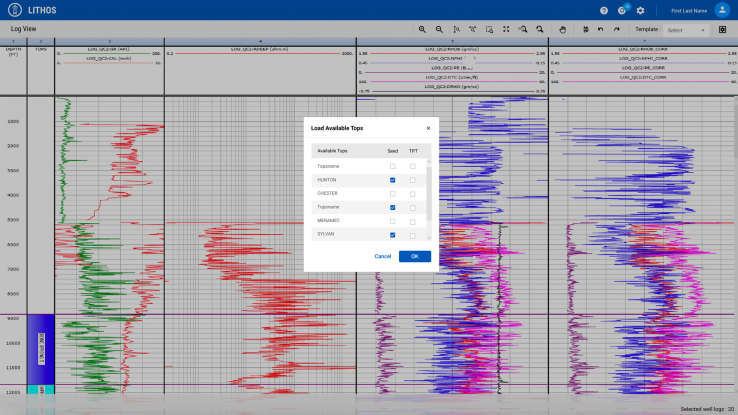
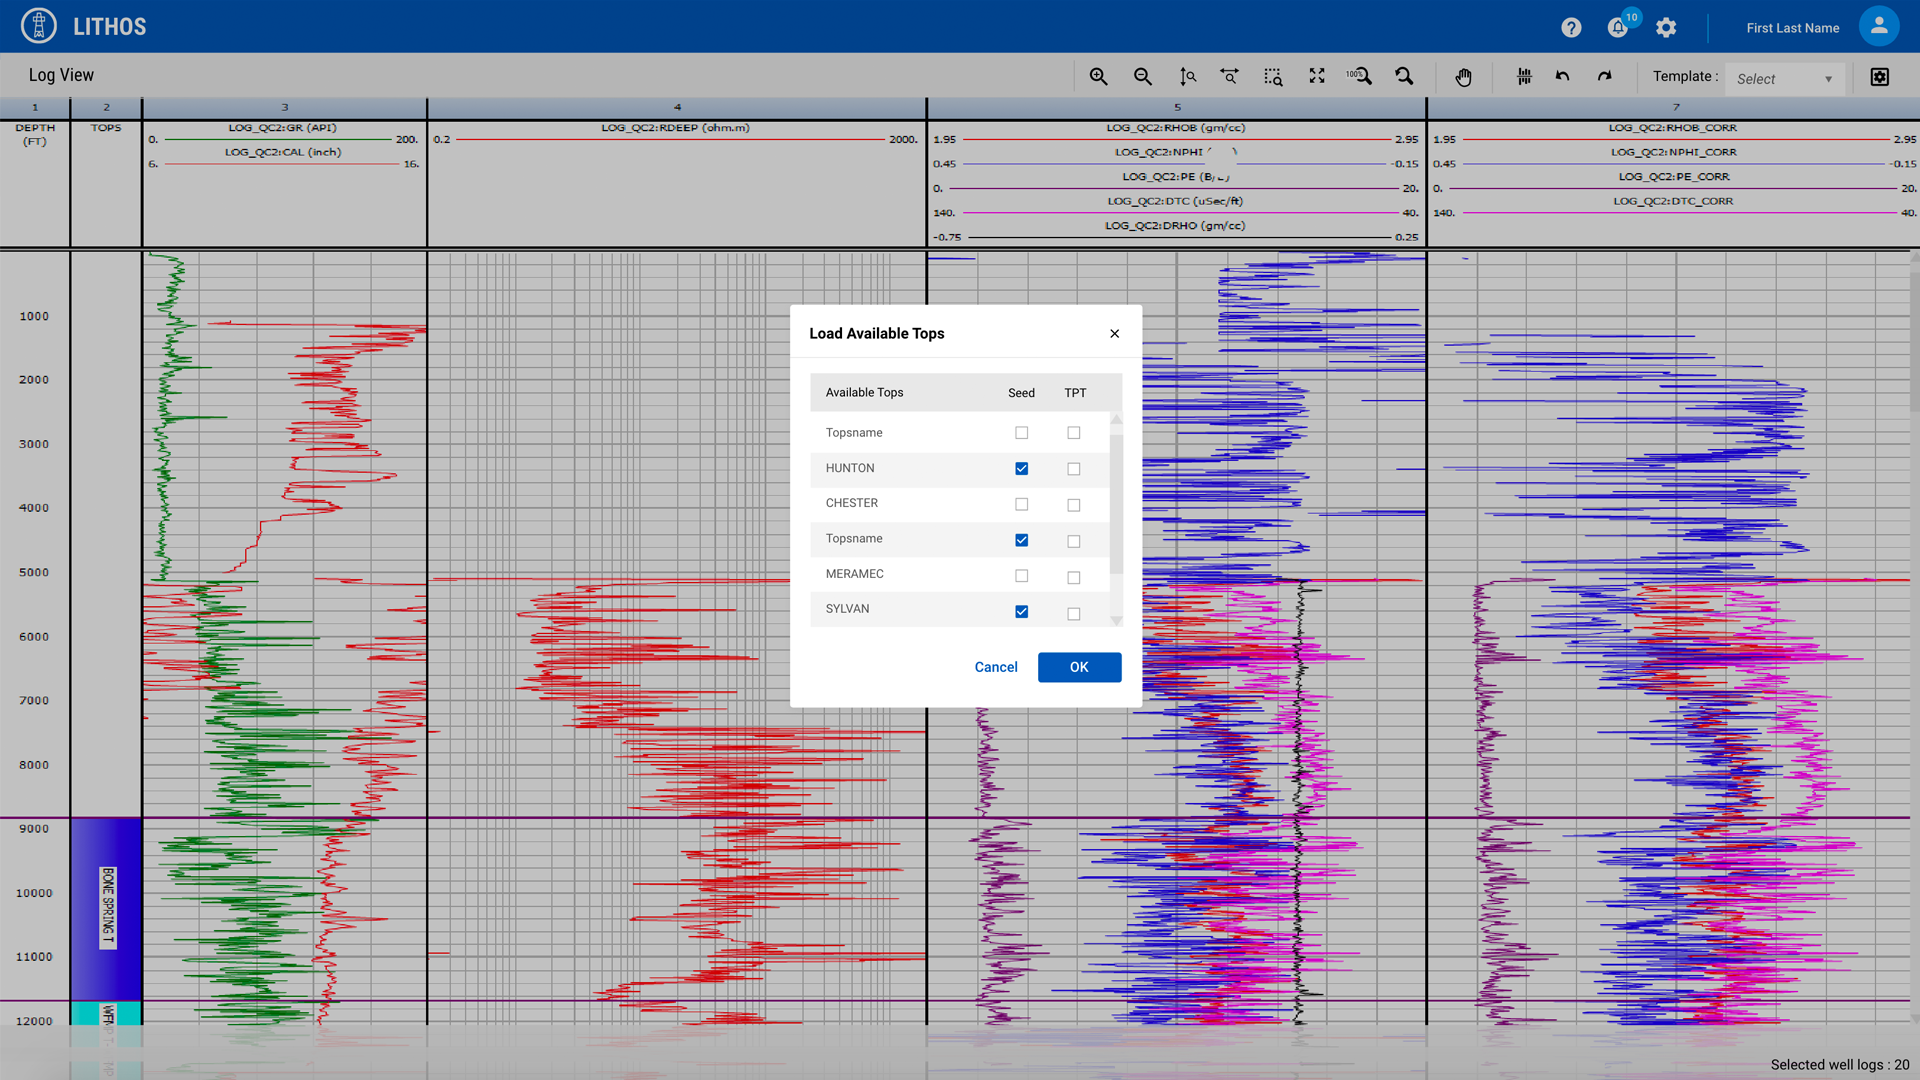
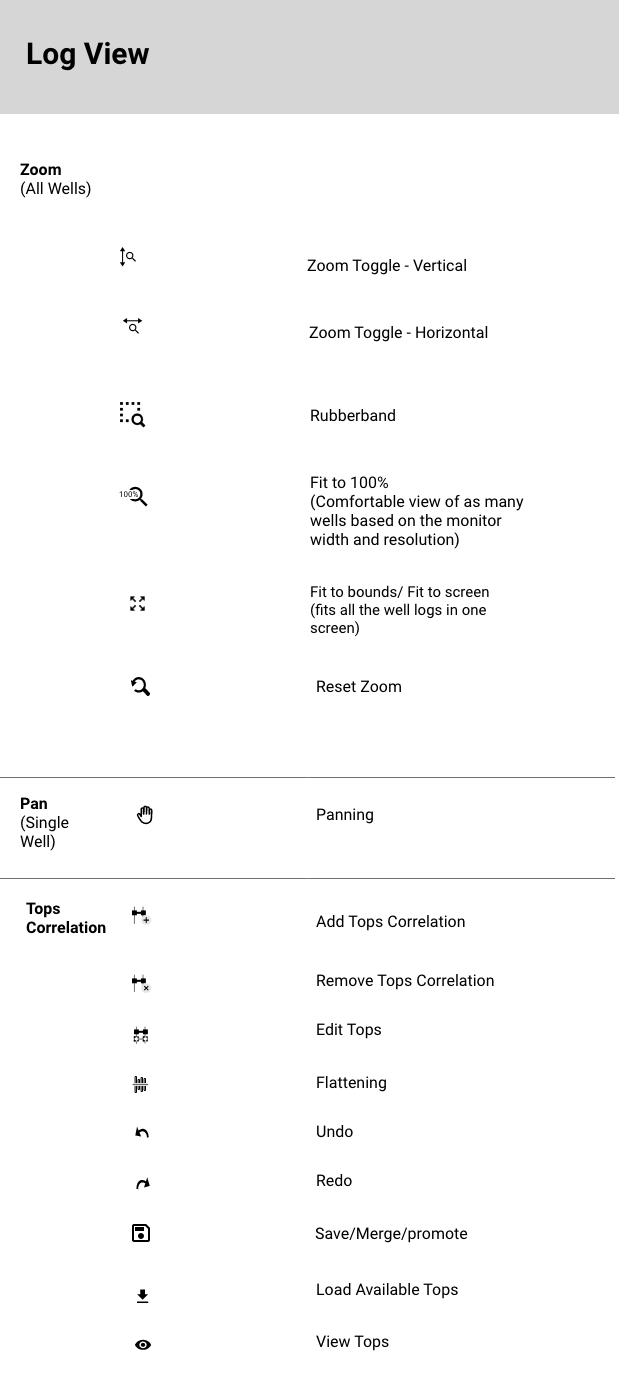
Some of the user stories are : Map View, Log View - Functions & Toolbar, Run TPT, Generate Surface, Load Tops, View Tops, Log QC, and Other sections of the product which includes form pages, tables, etc
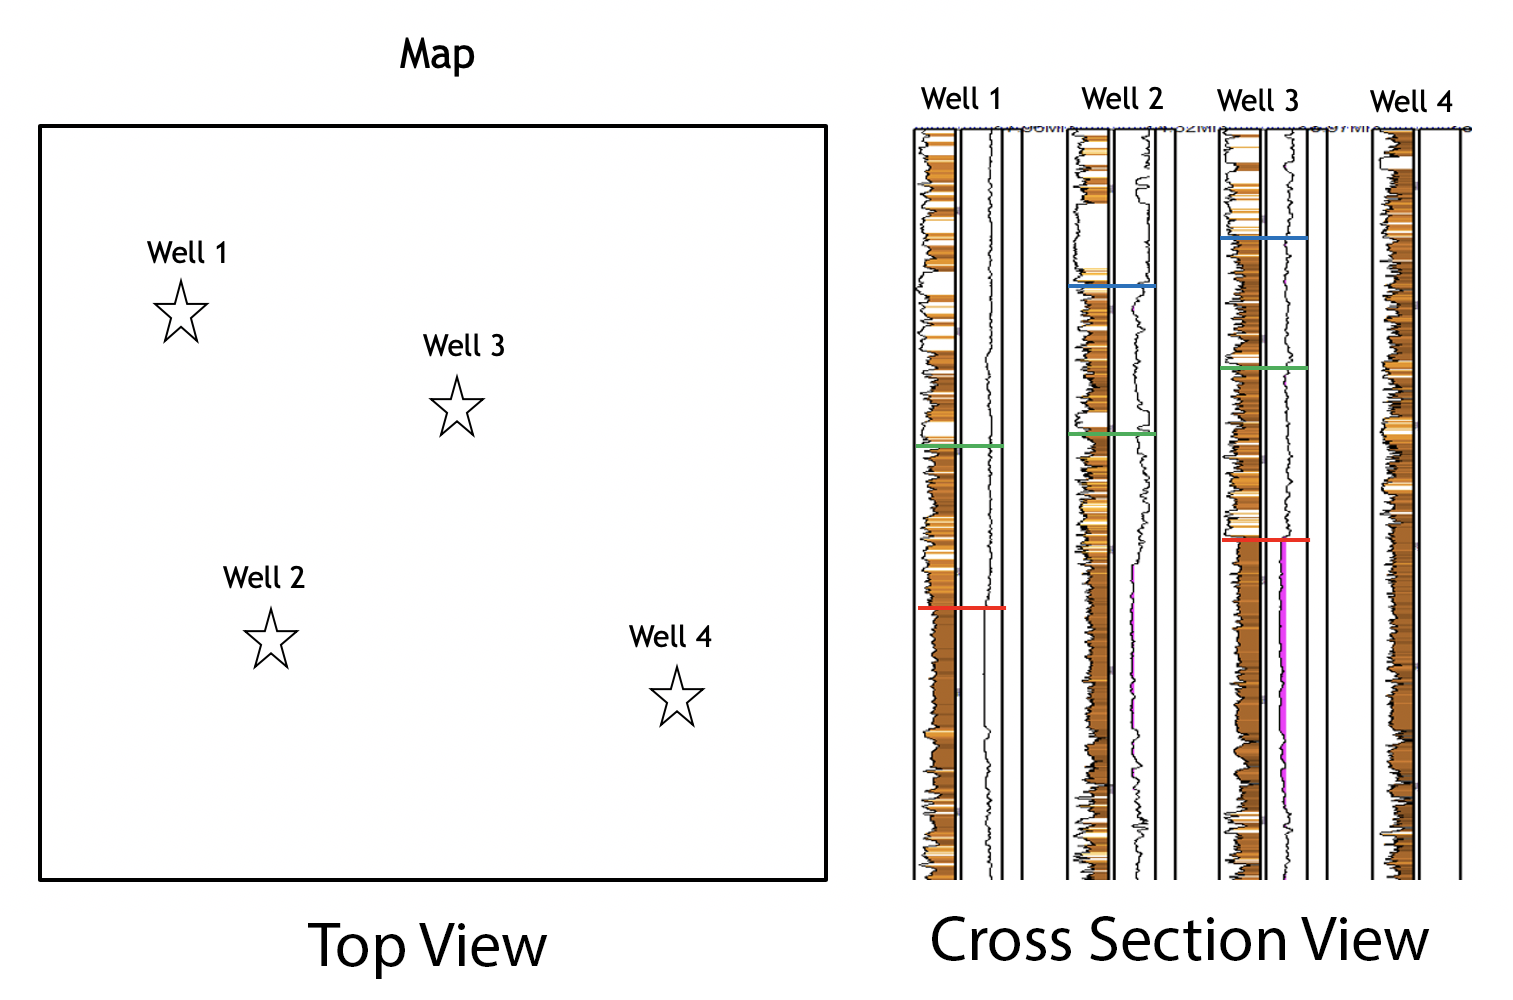
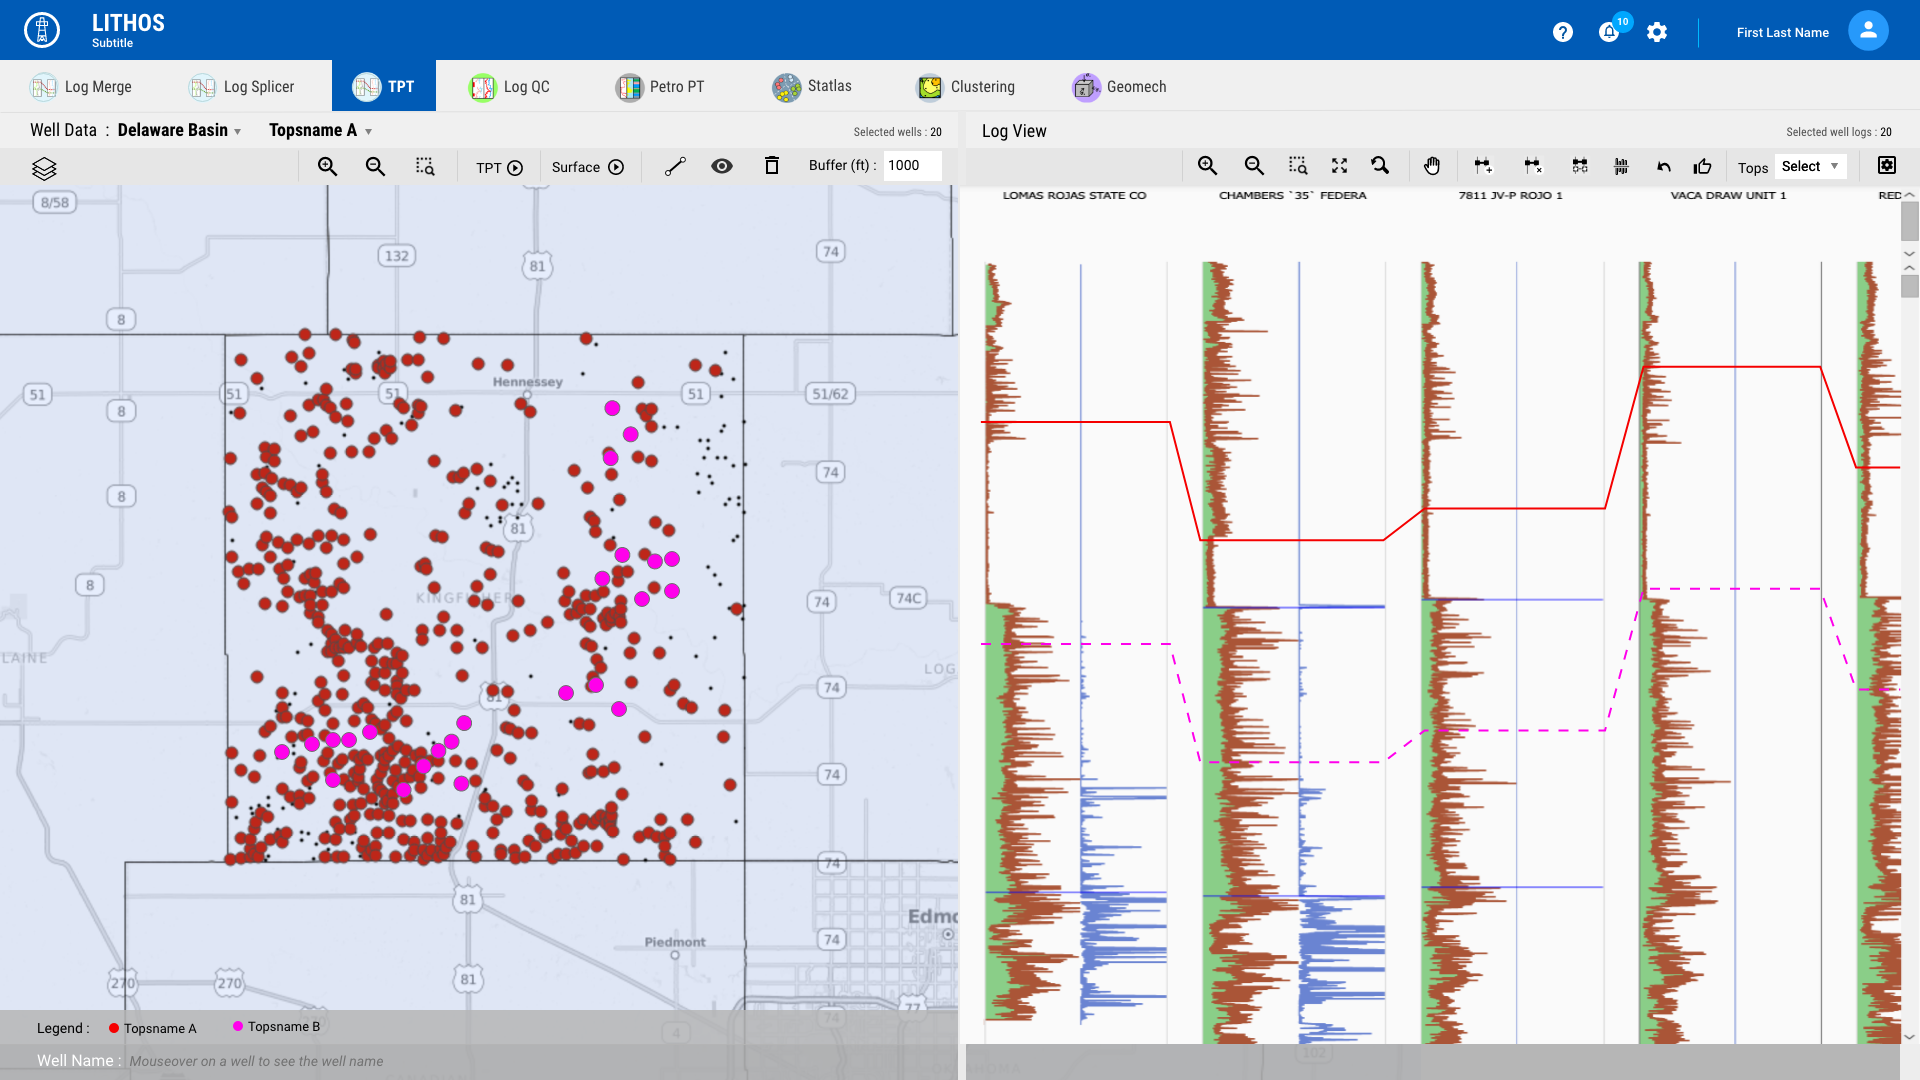
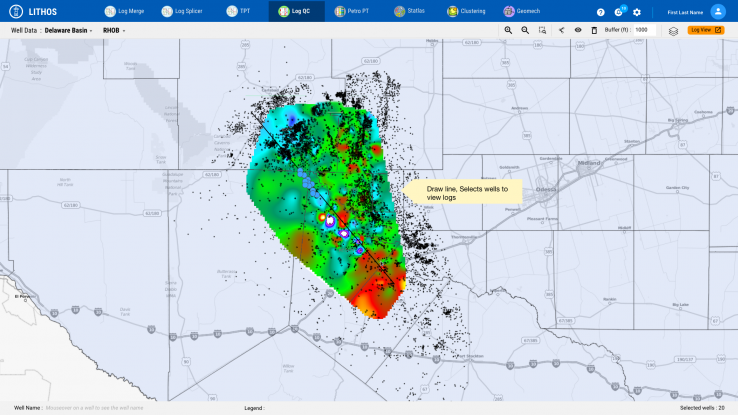
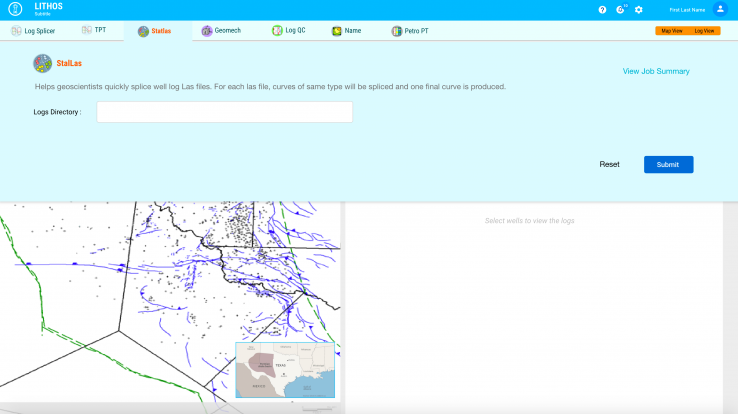
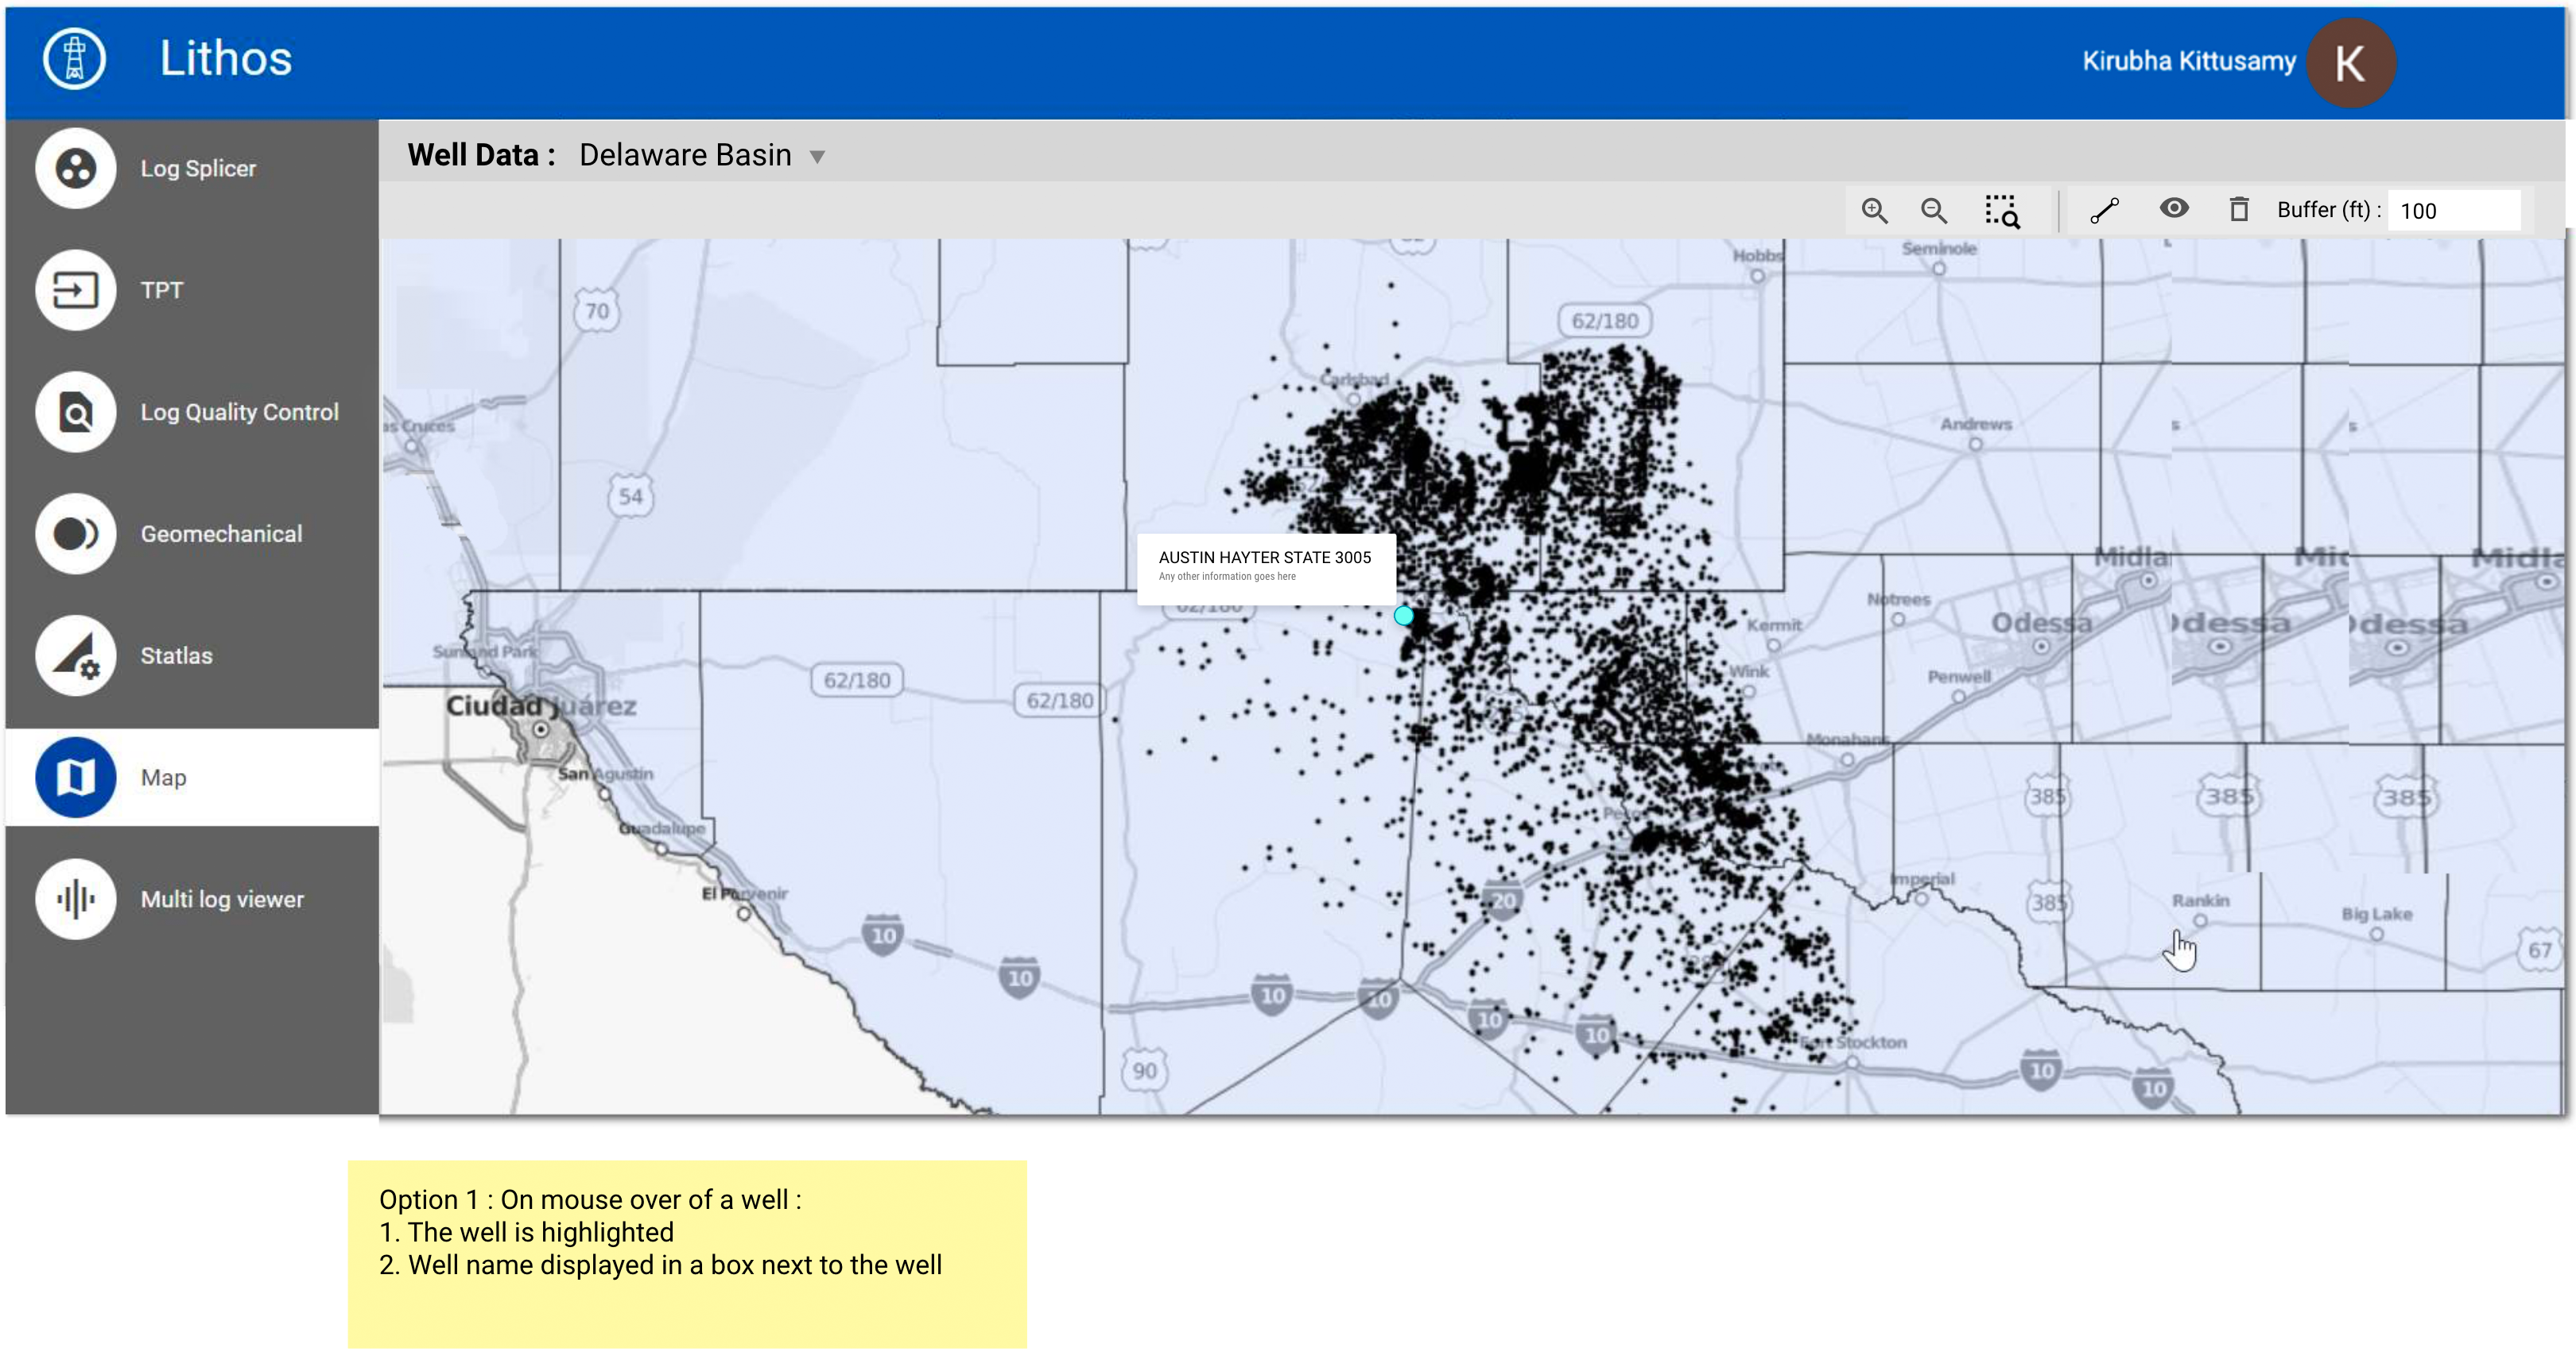
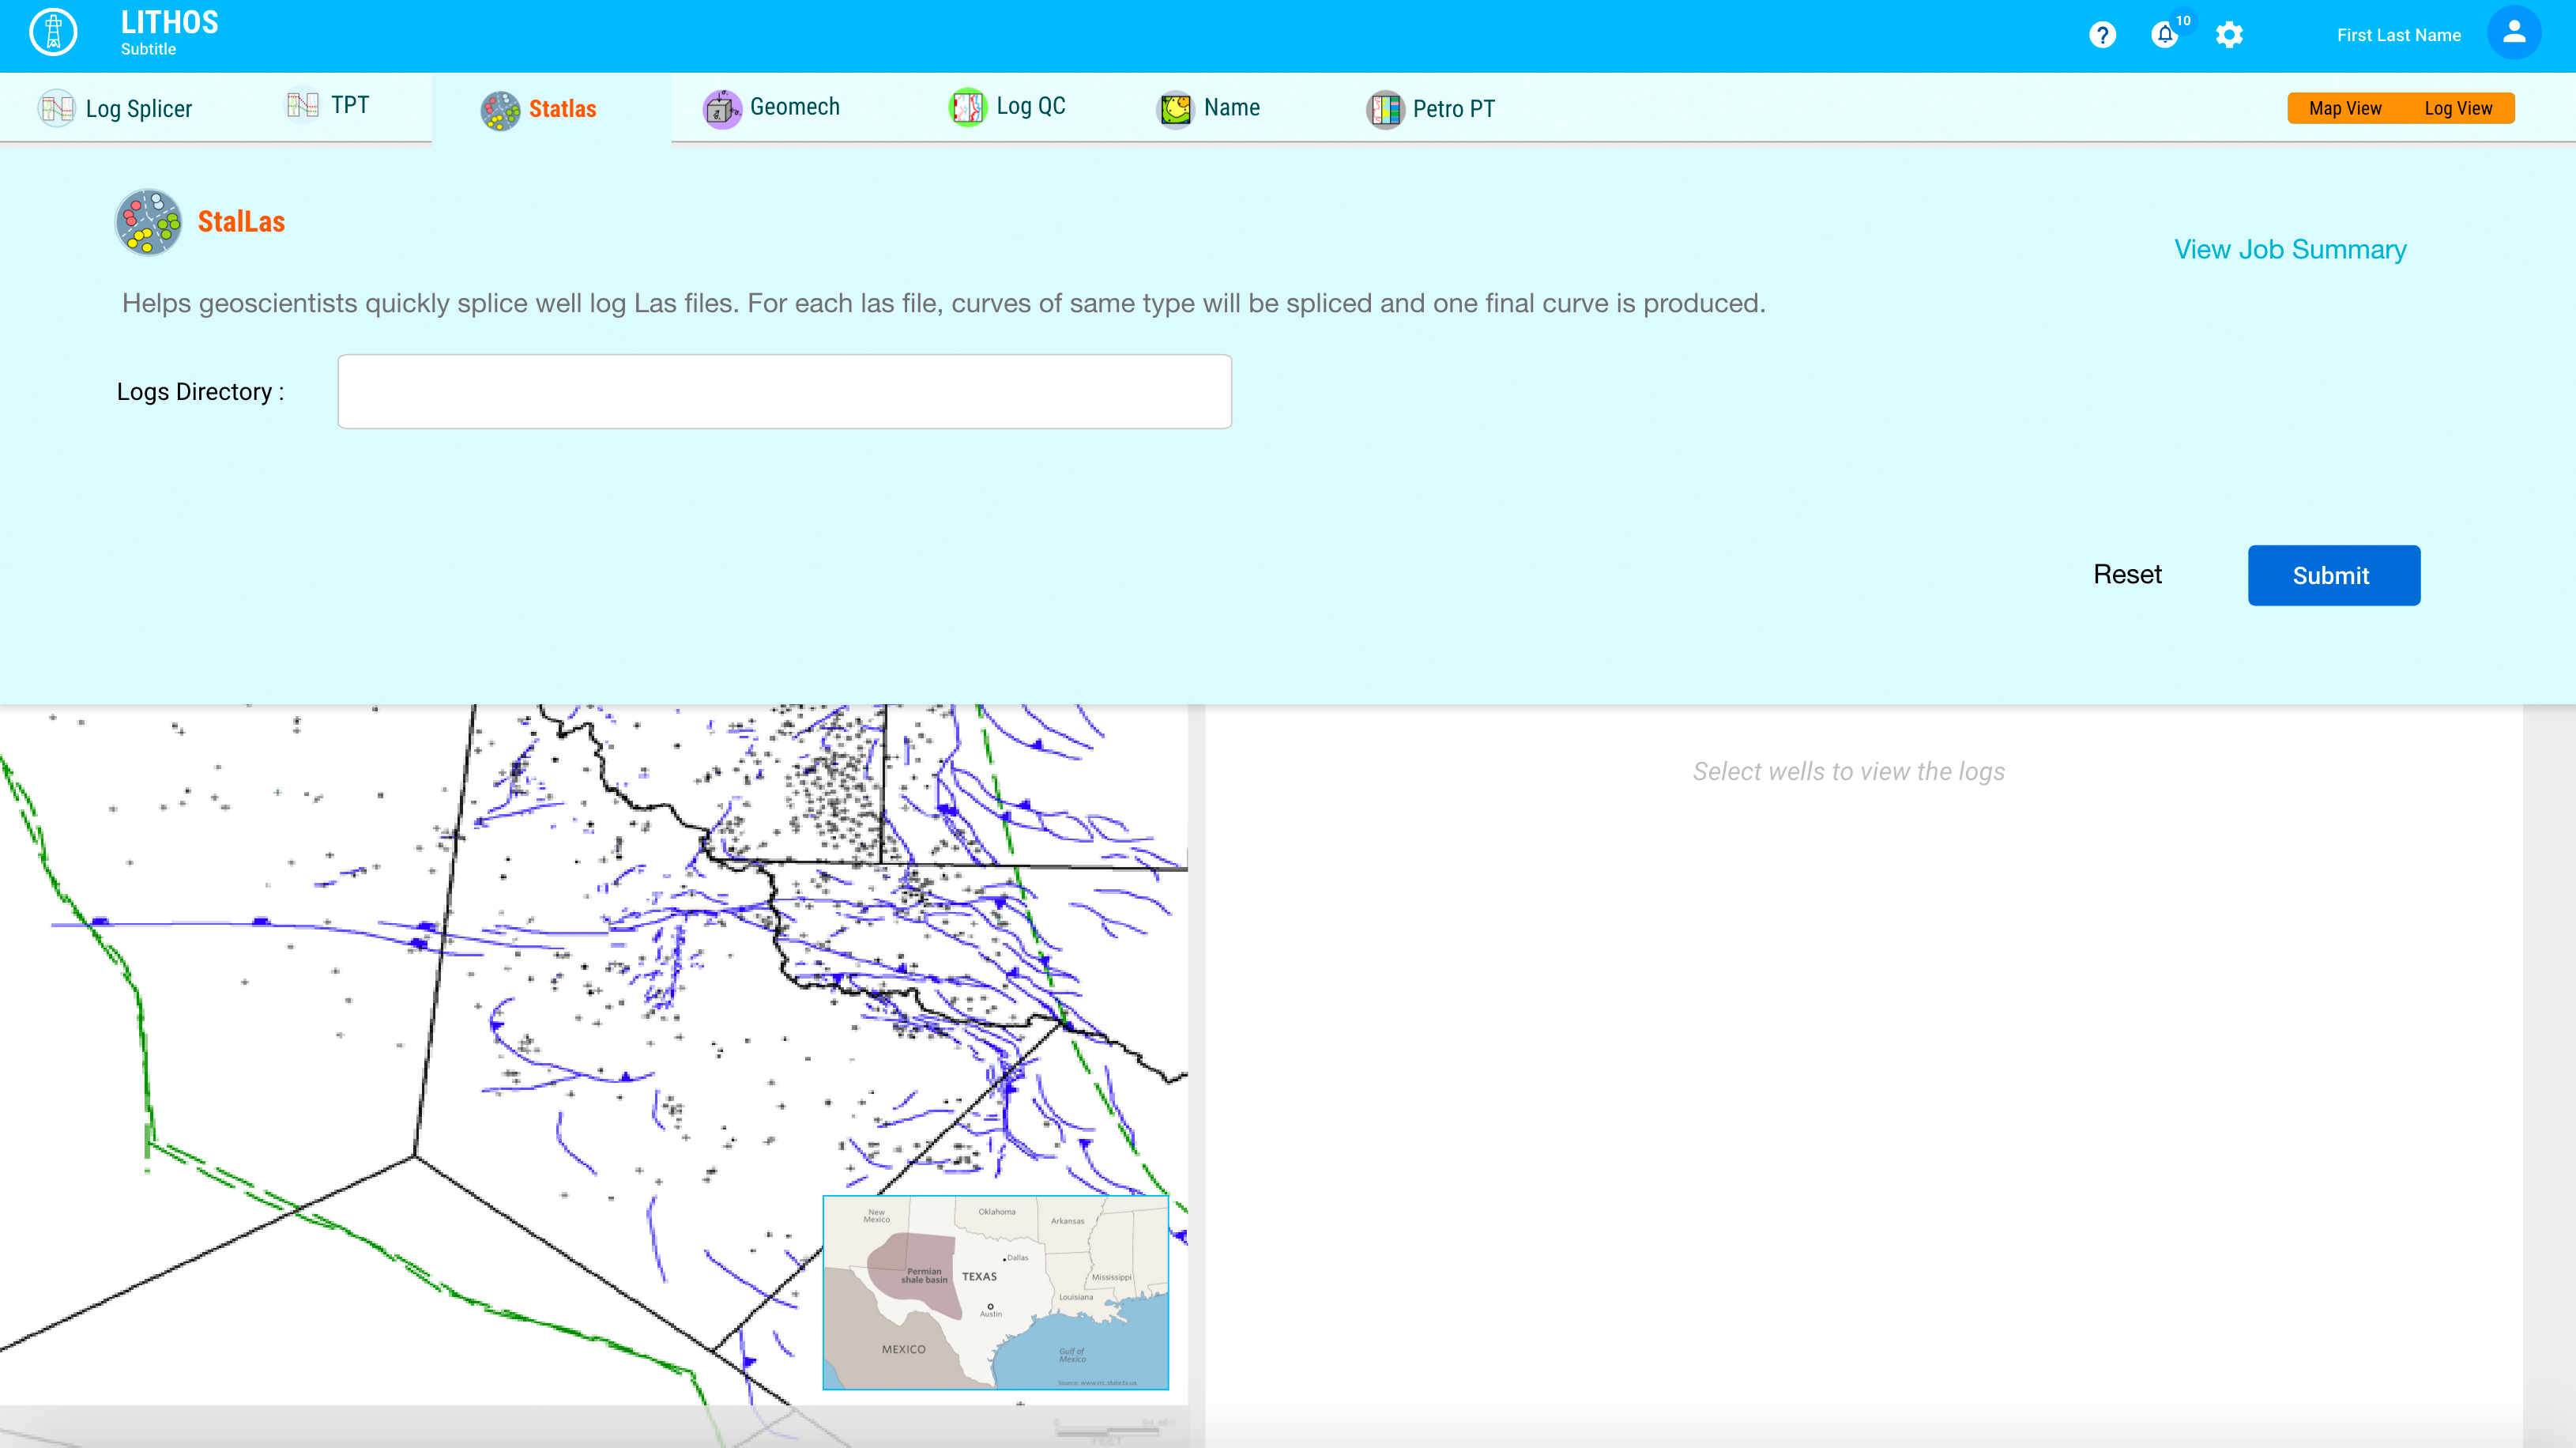
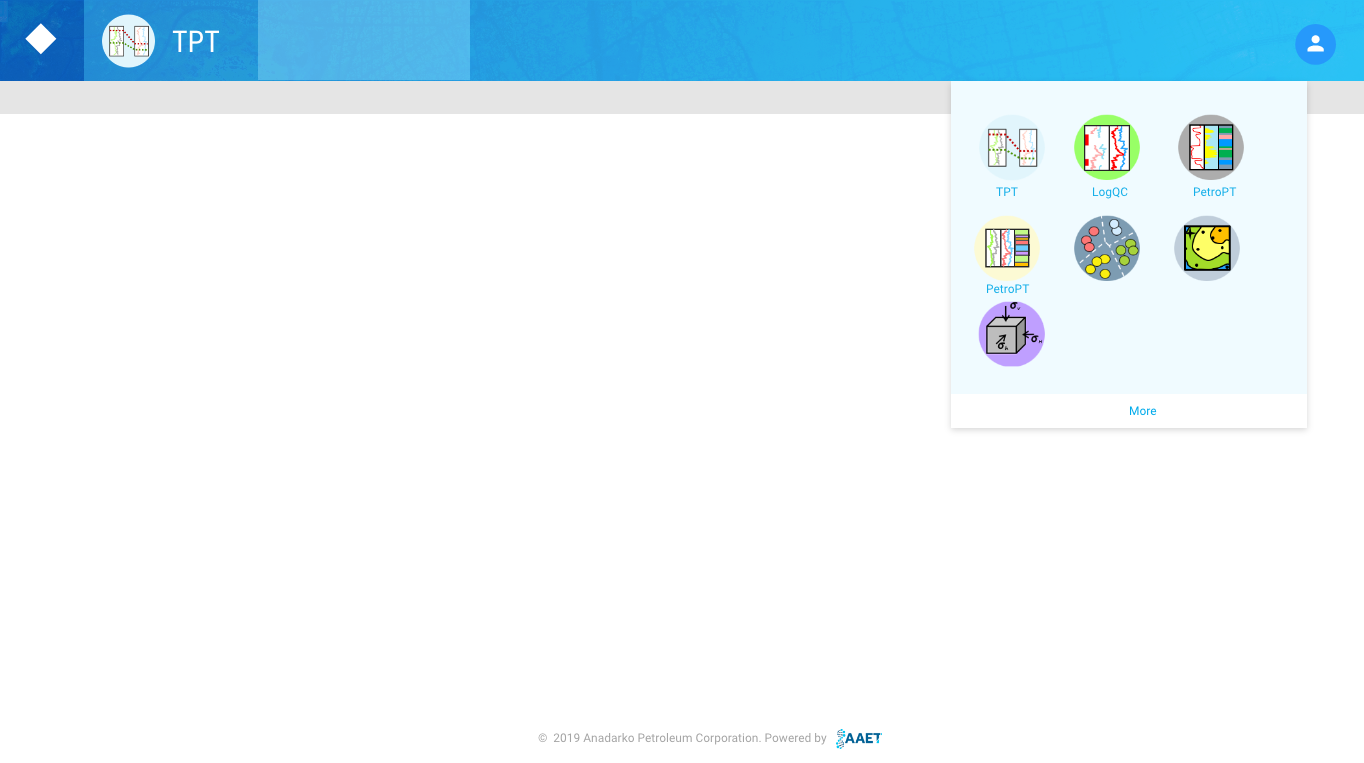
Landing Page Flow - Map & Log View
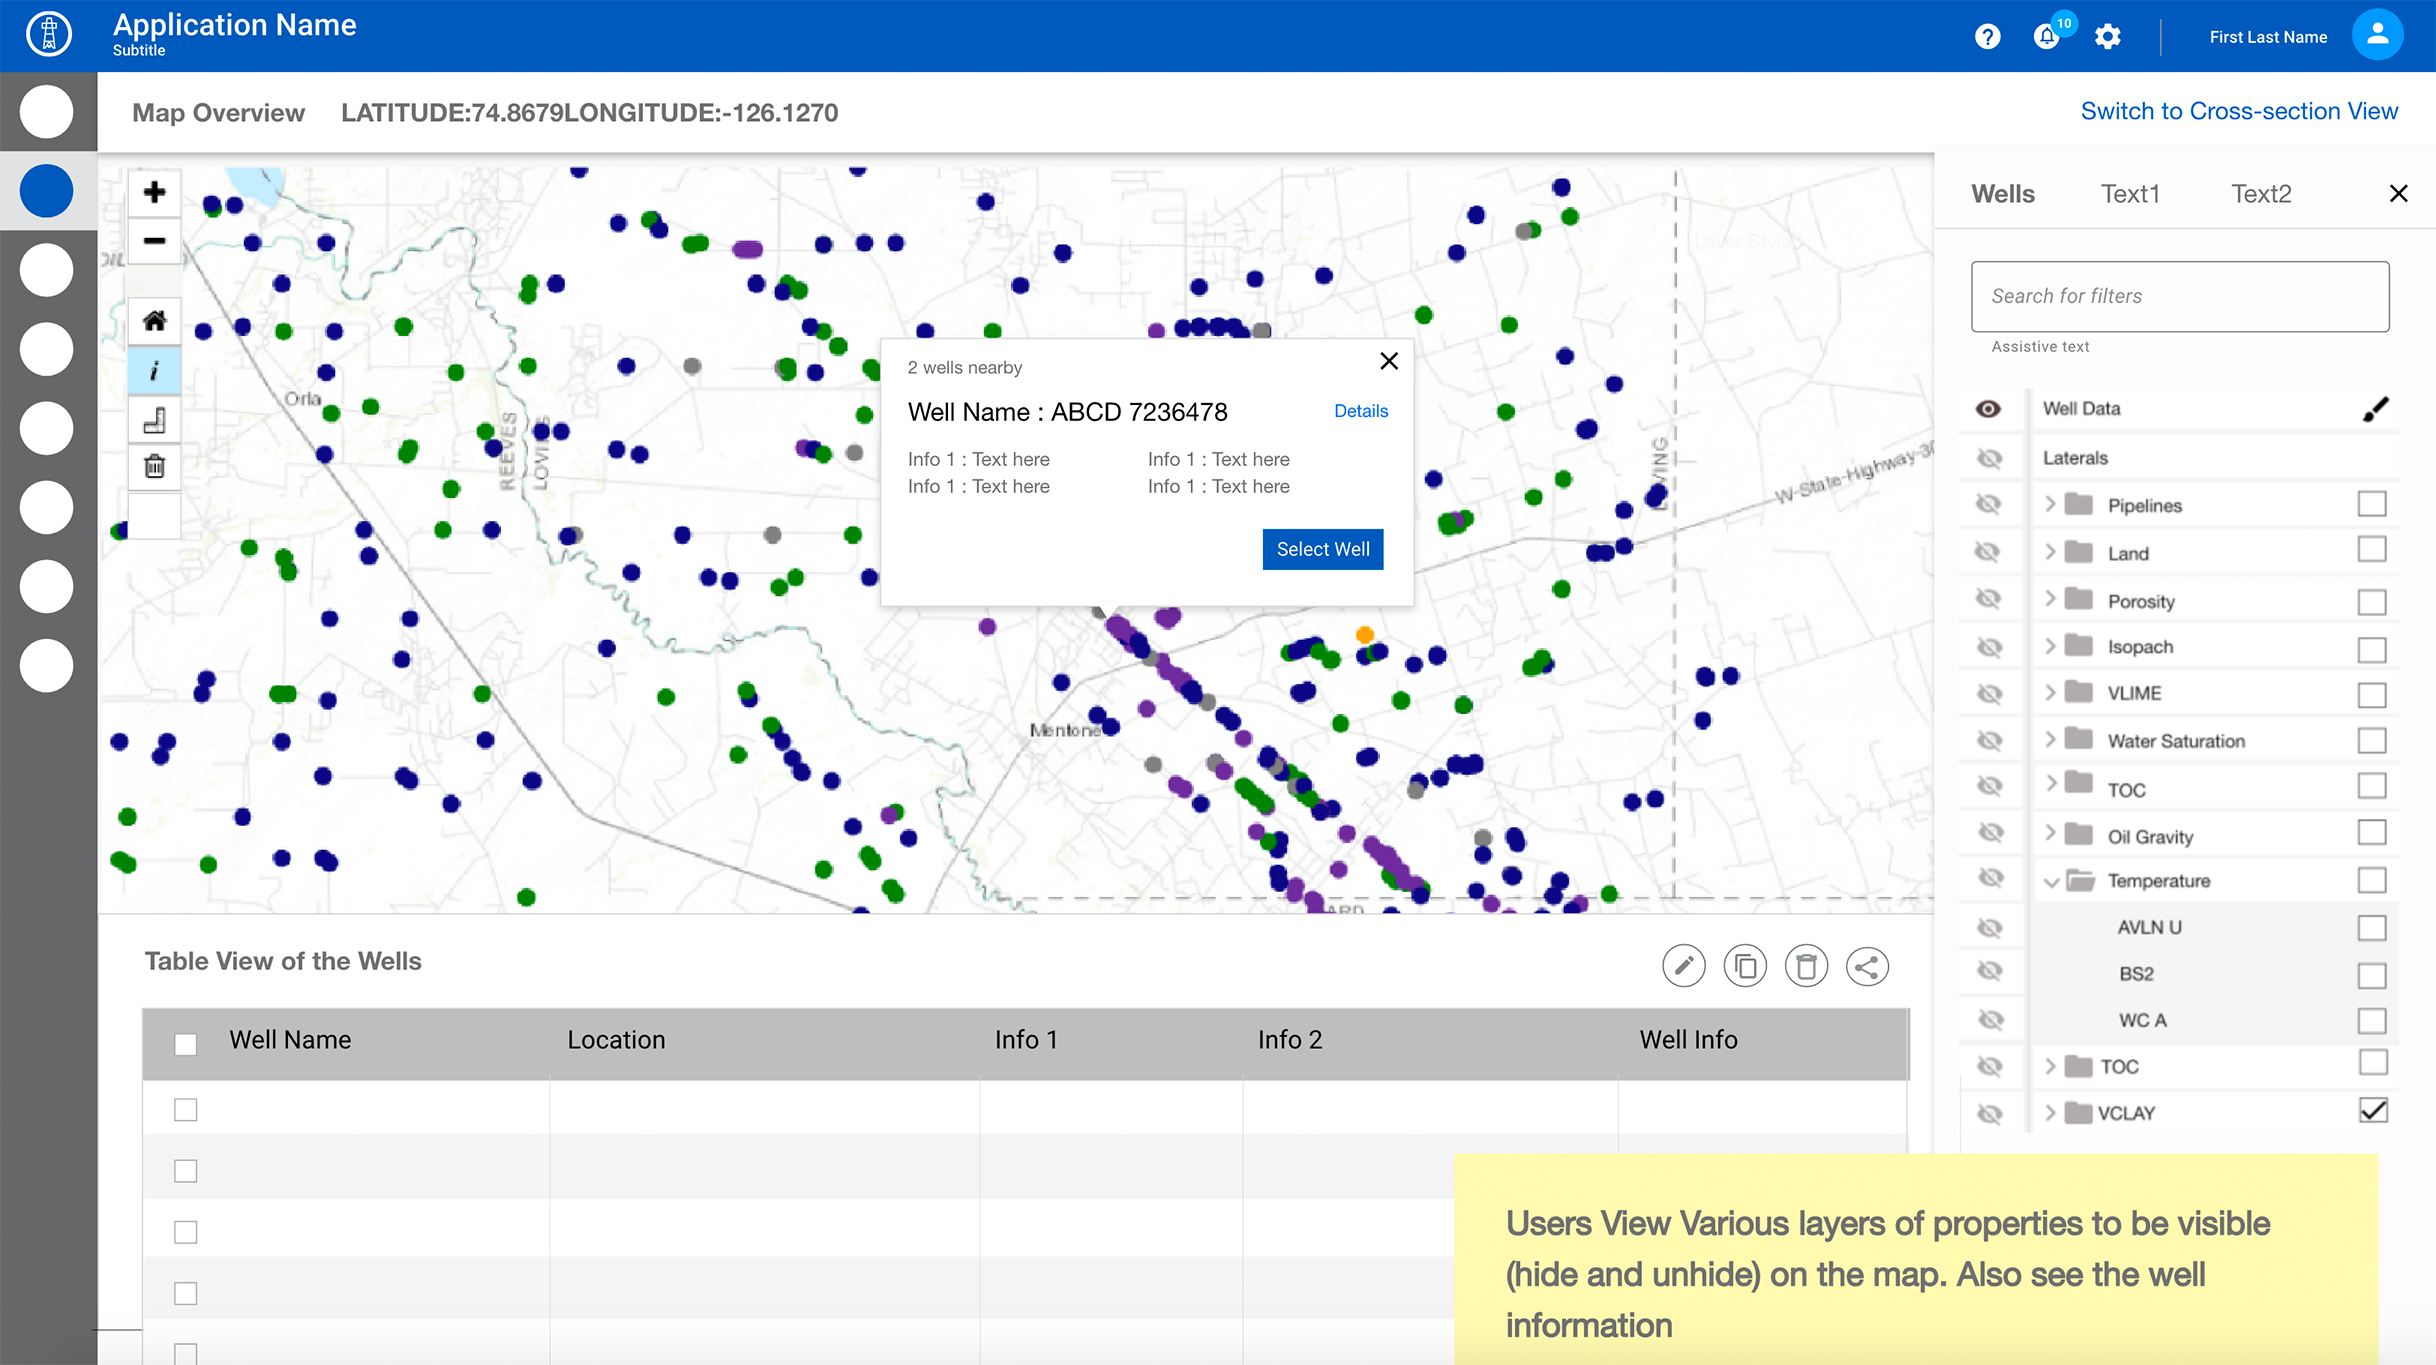
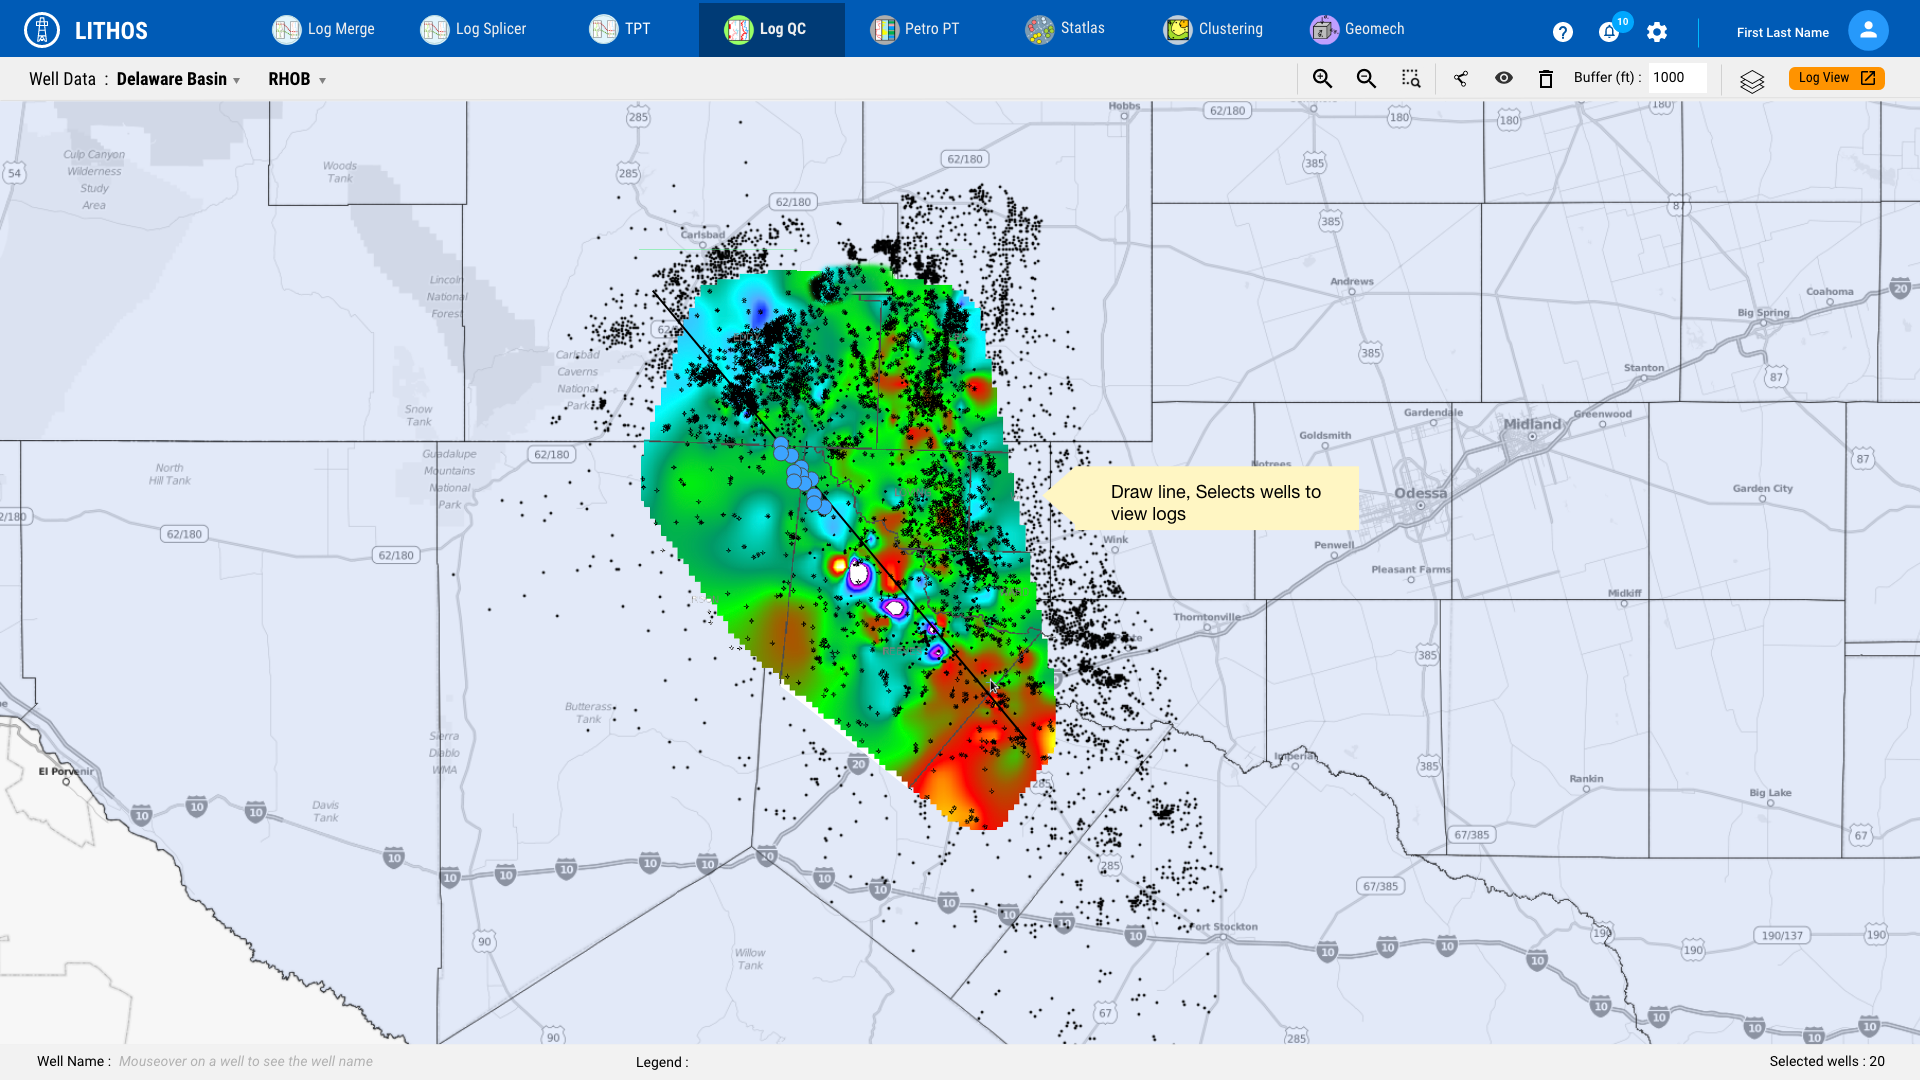
Some of the features of Landing page - Map & Log View :
- Overall - Map View / Log View
- On Mouseover see well name
- Draw lines
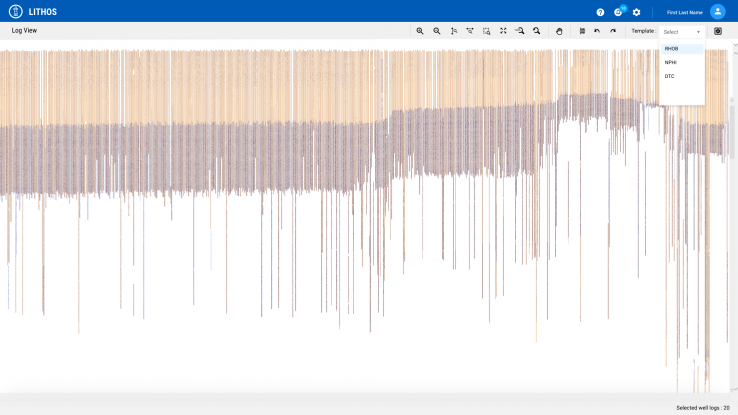
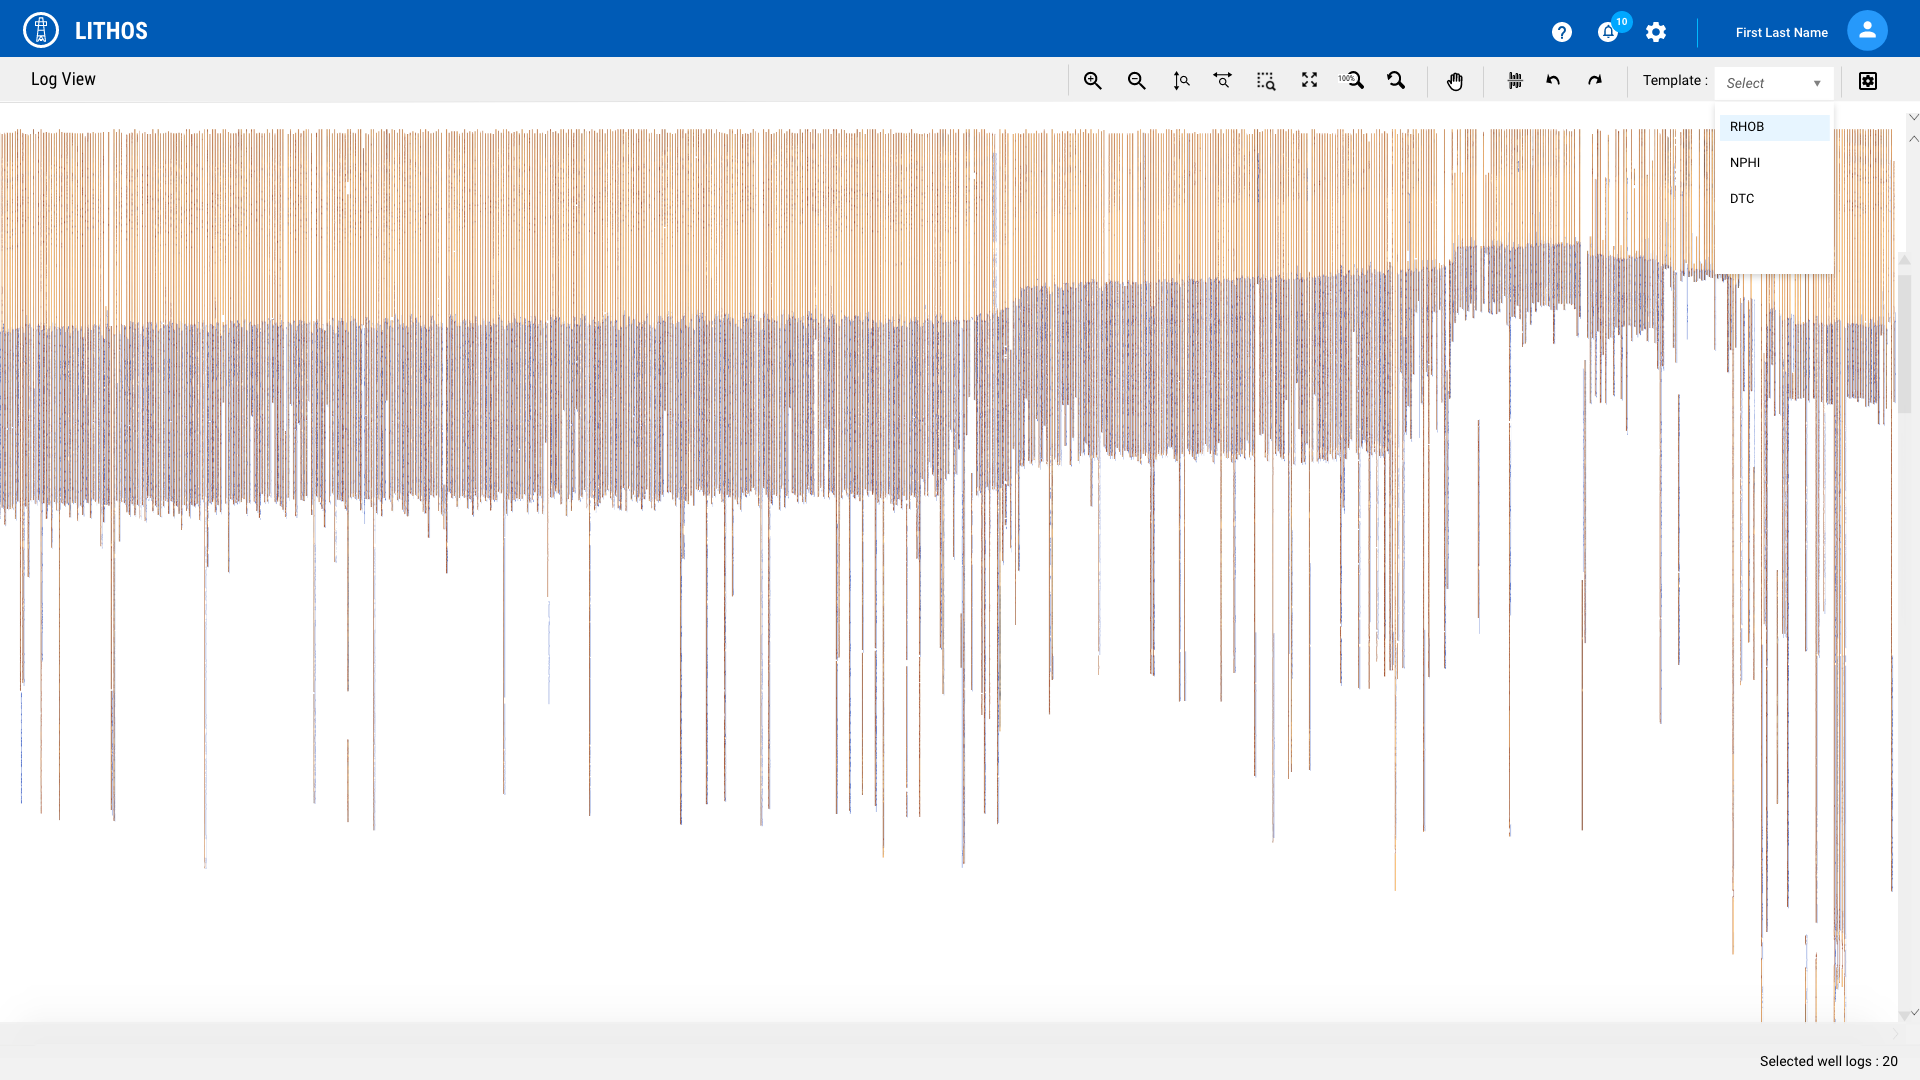
- Loading of well Log Viewer
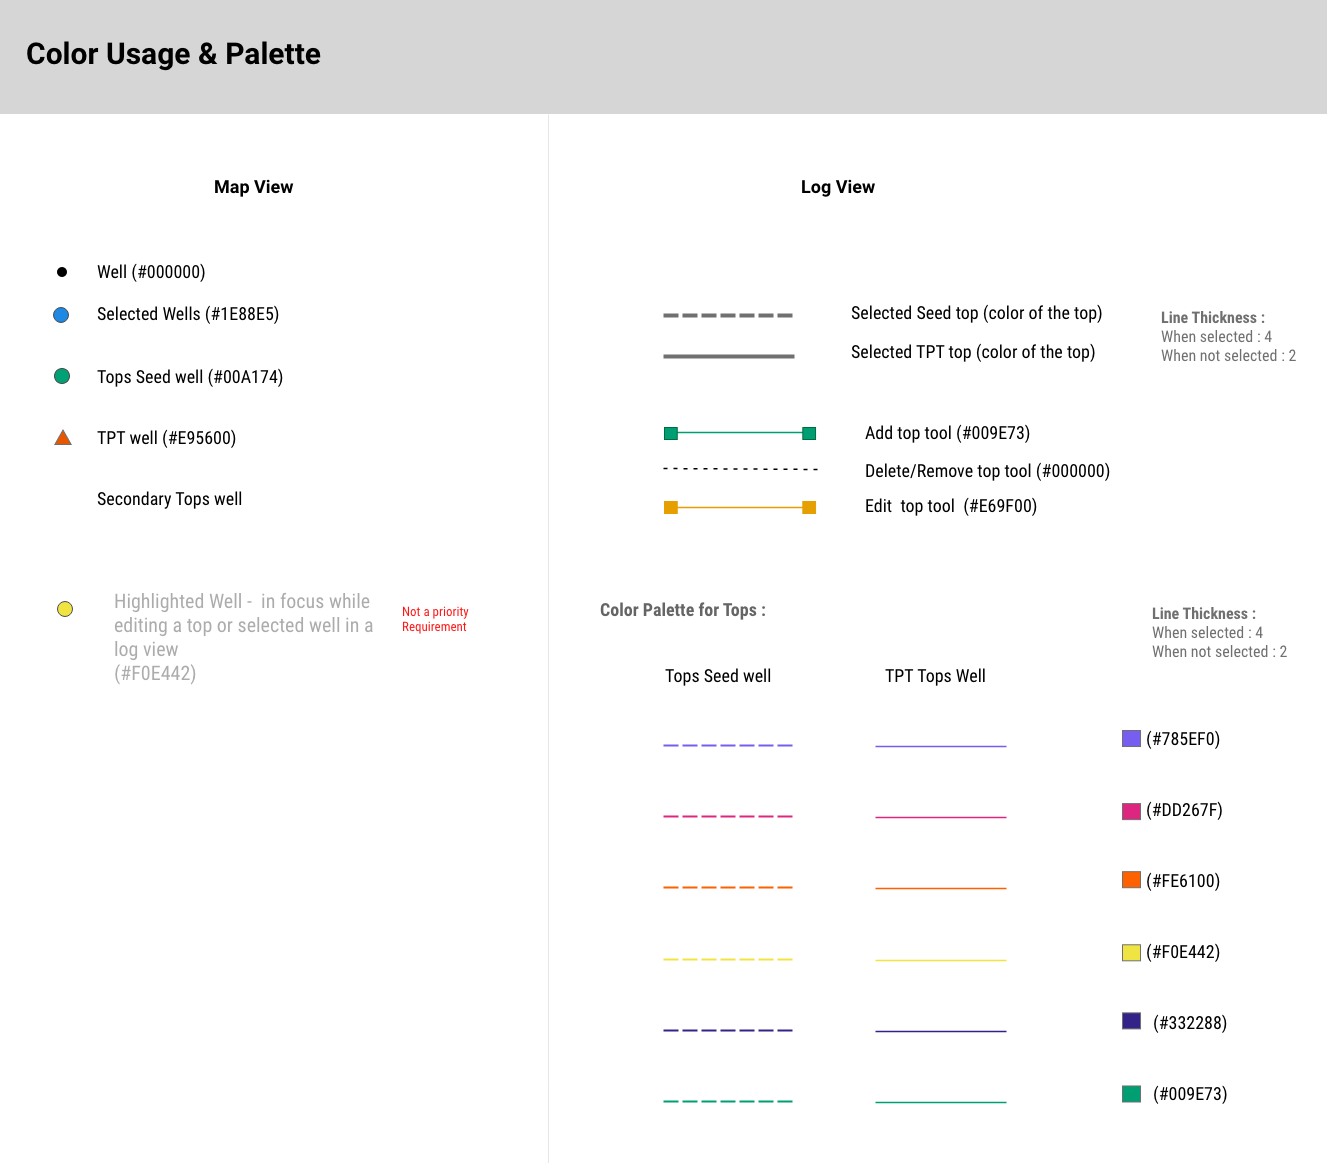
- Show tops on Well log viewer
- Zoom - Toggle for Horizontal & vertical zoom on Log Viewer

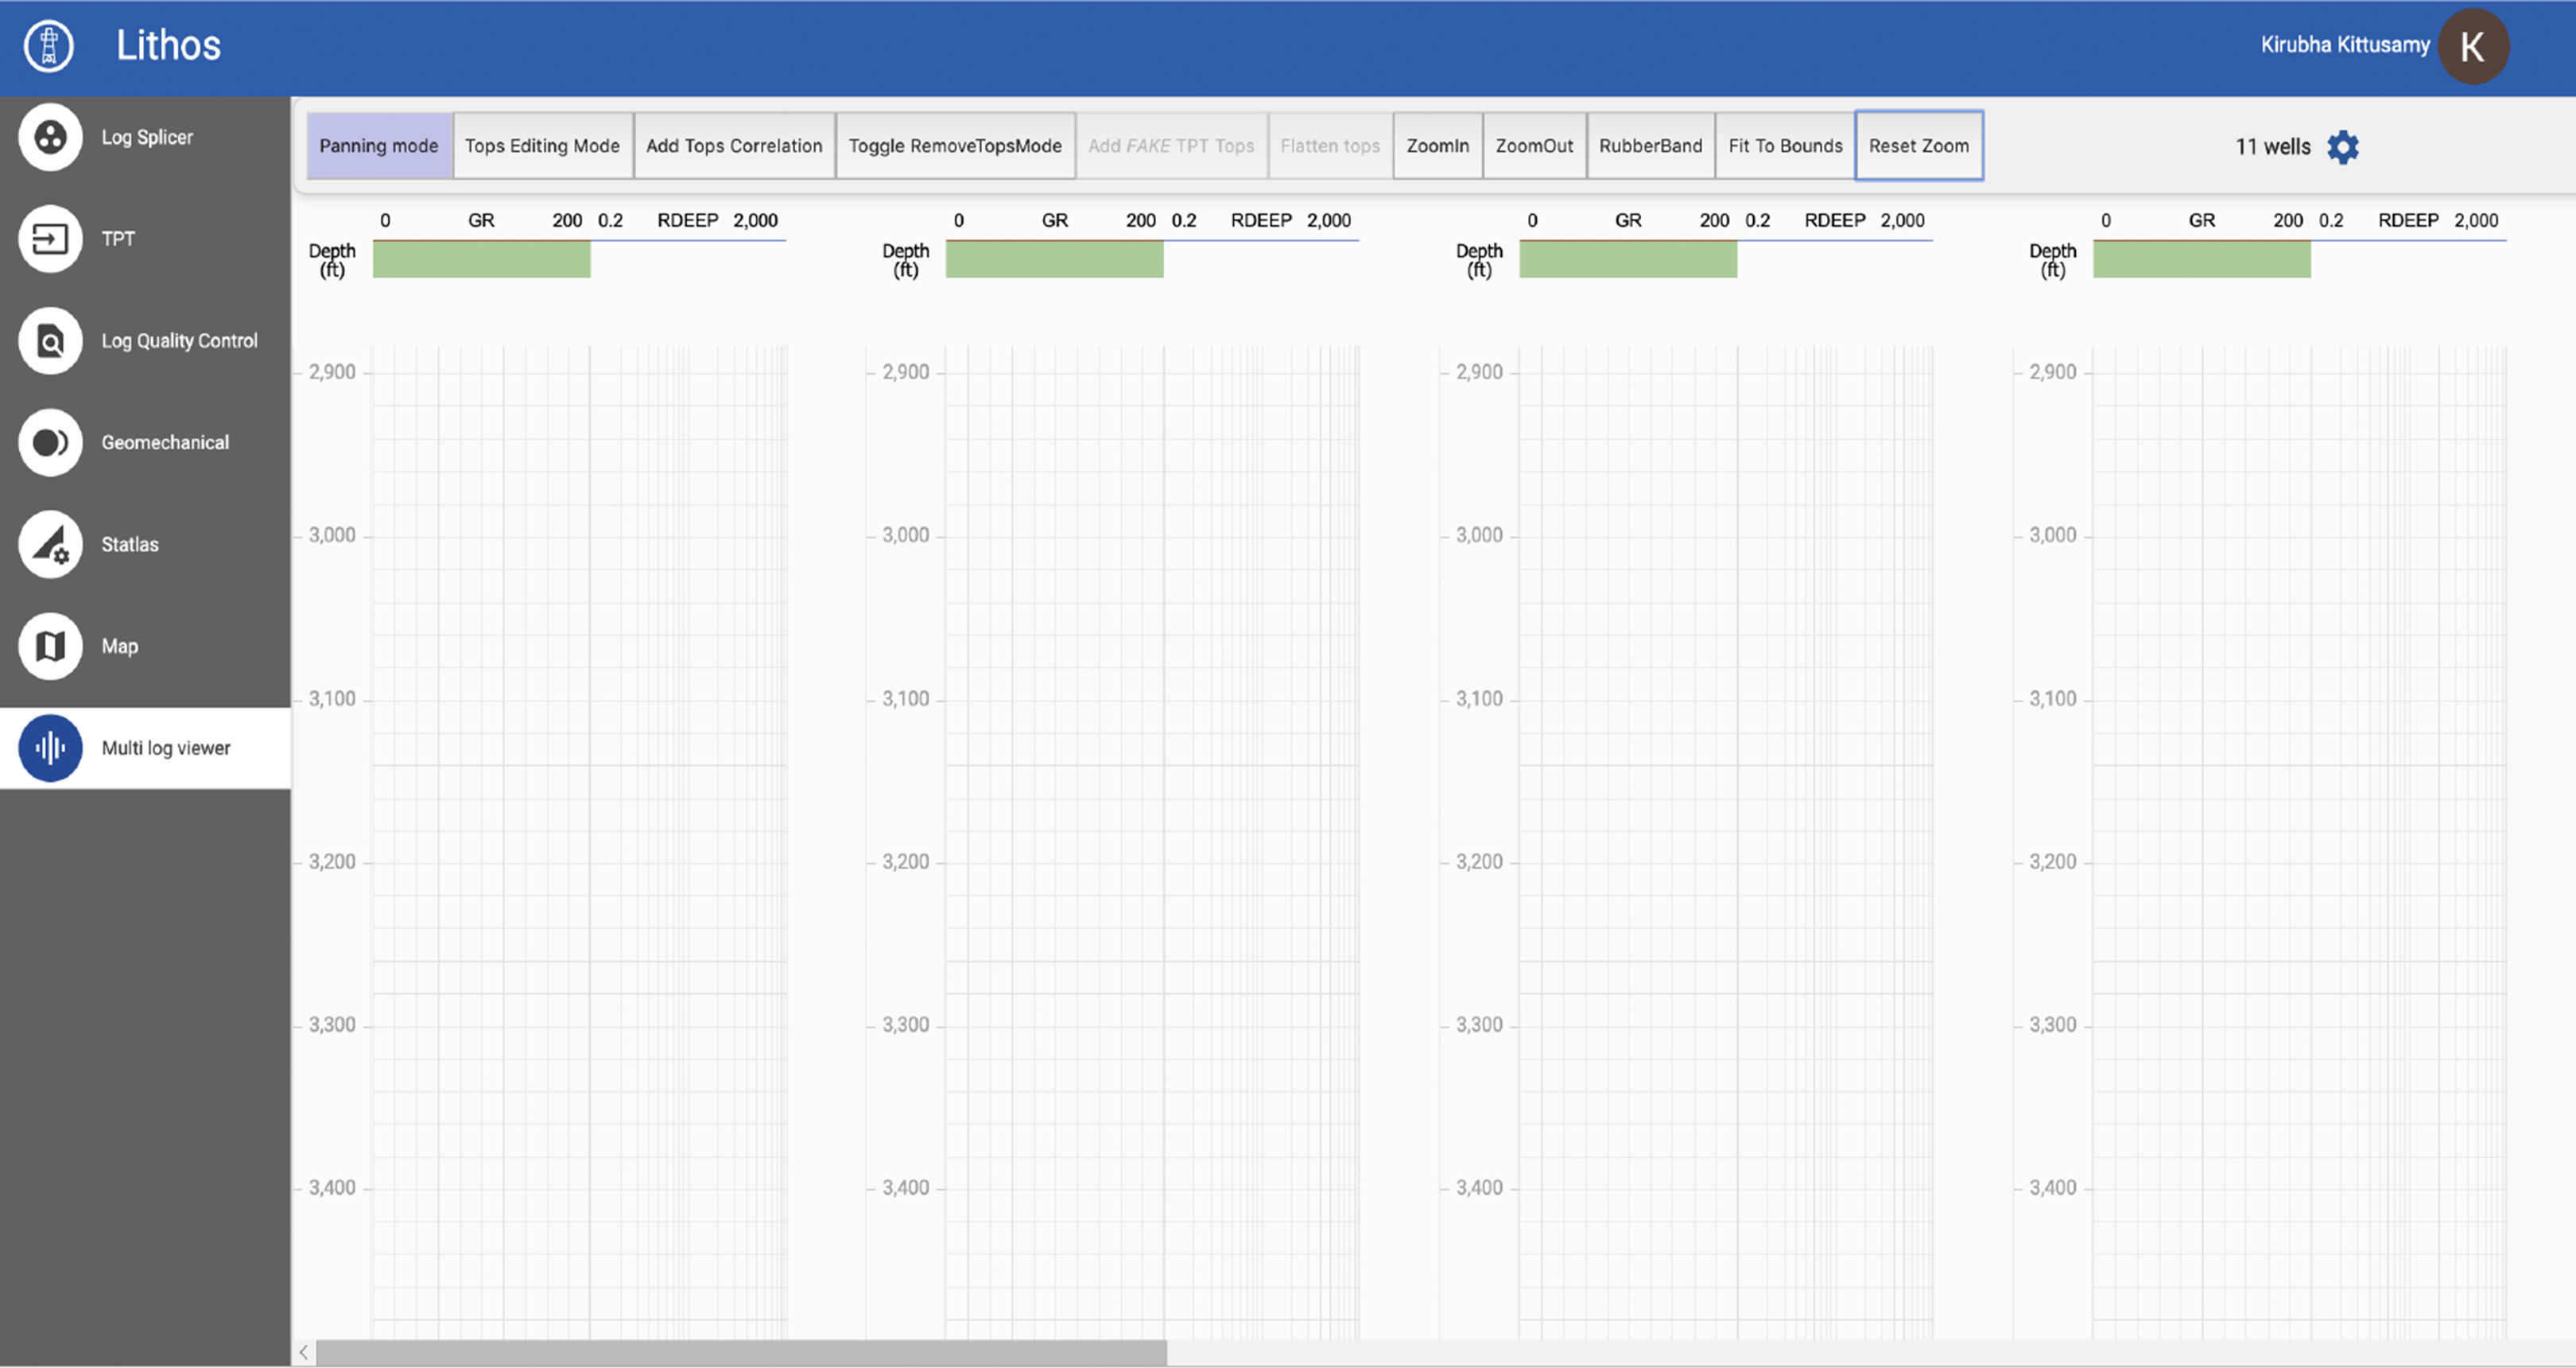
Wireframe Flows - Hi Fidelity - Landing Page Interaction for Map & Log View
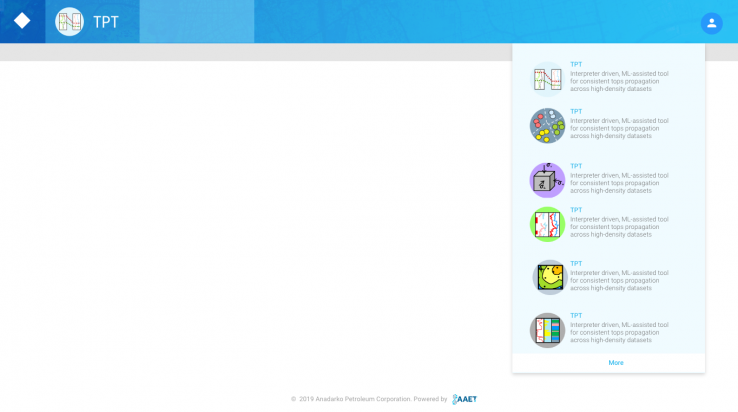
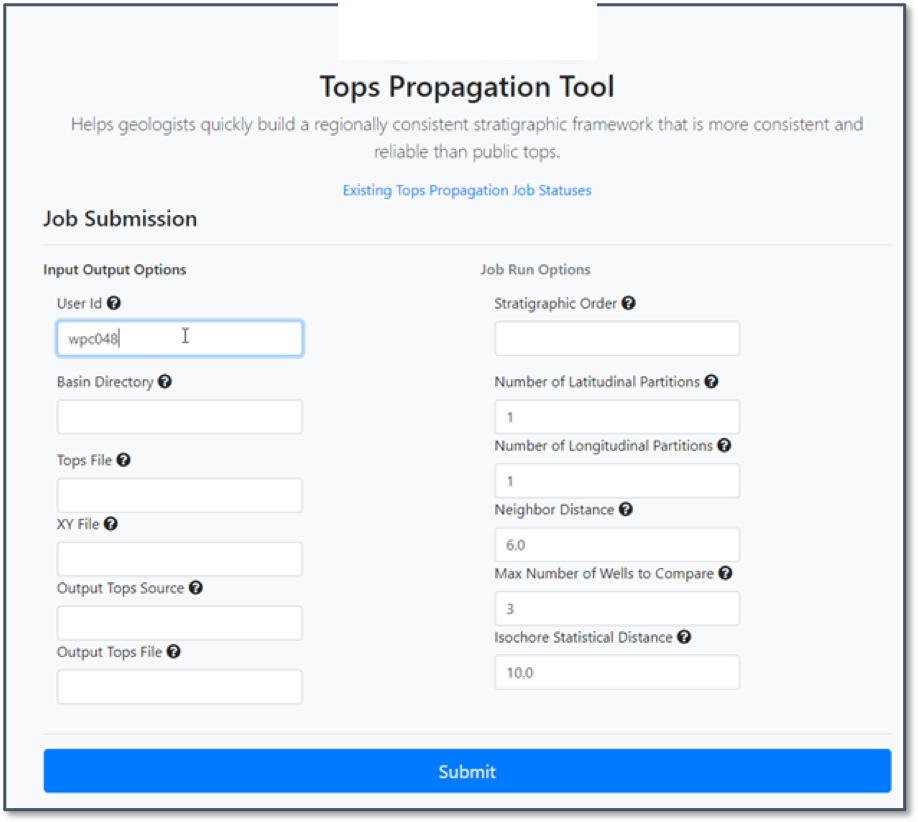
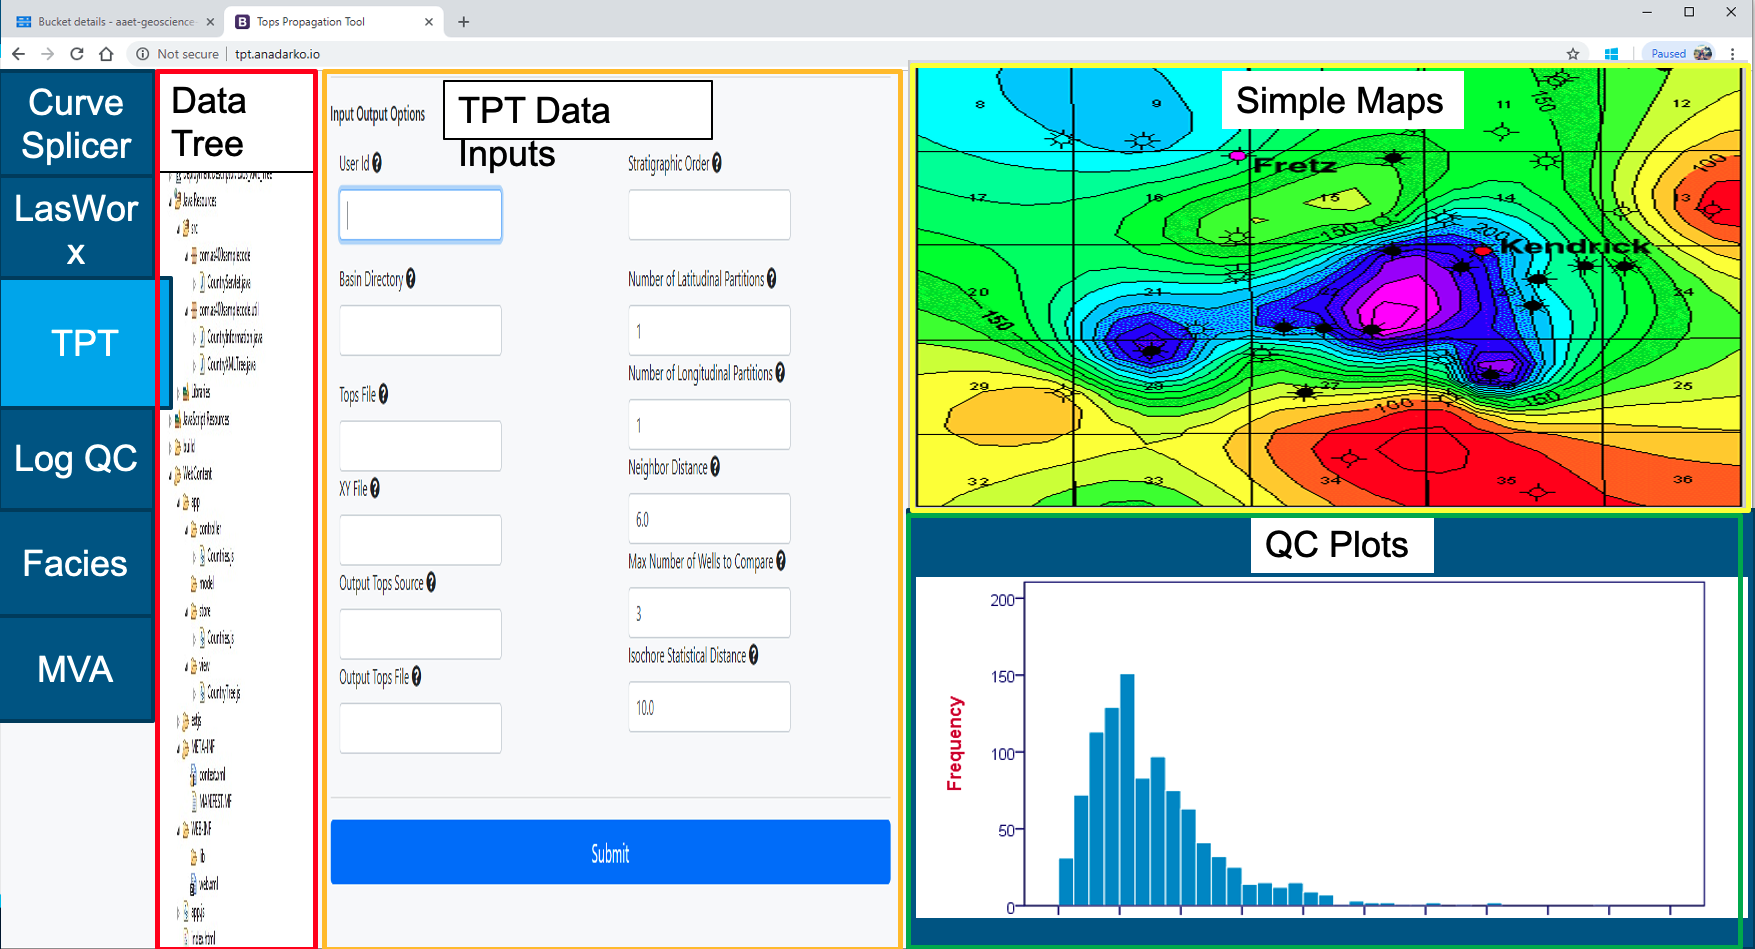
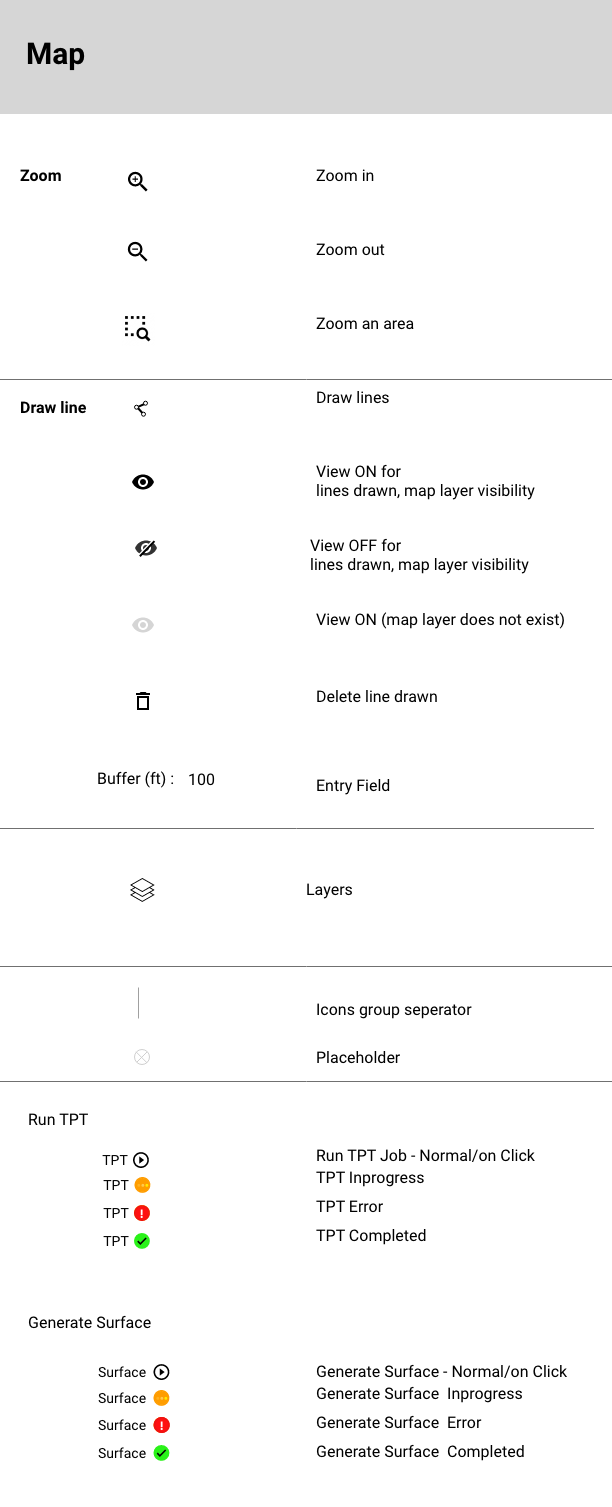
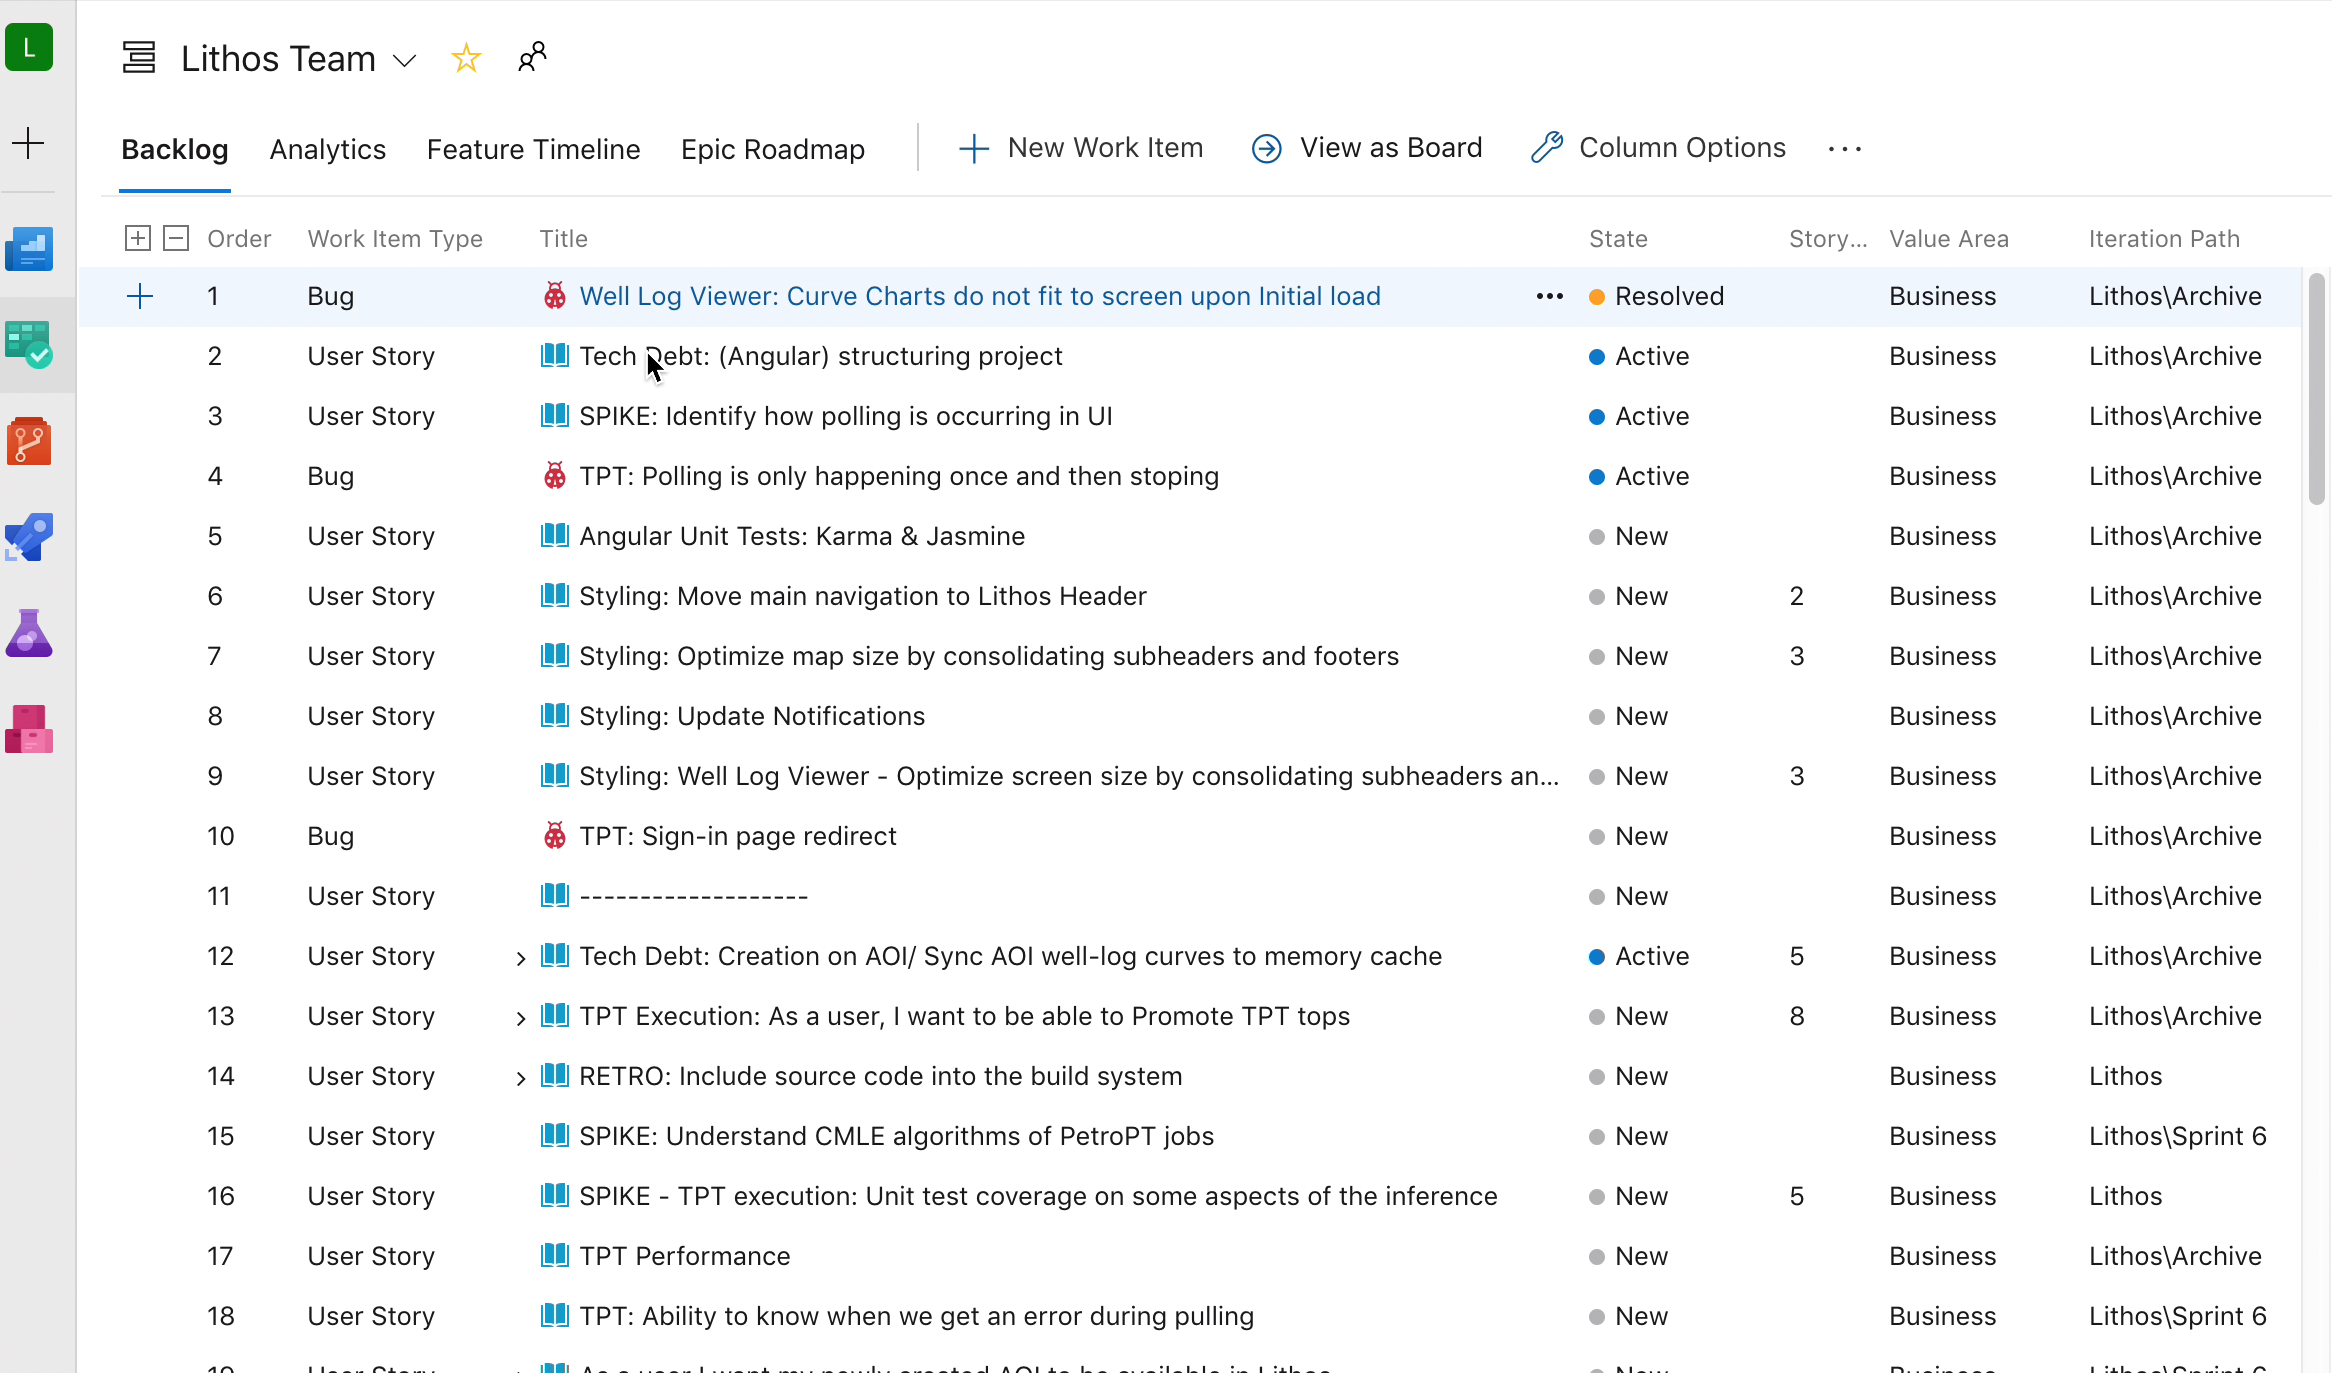
Map Feature - Run TPT & Generate Surface
Some of the map features - Run TPT & Generate Surface:
- Show status next to the icon by updating the maps & log views
- toolbar changes based on the interaction
- Generate surface map
- Show error or success messages based on the interaction
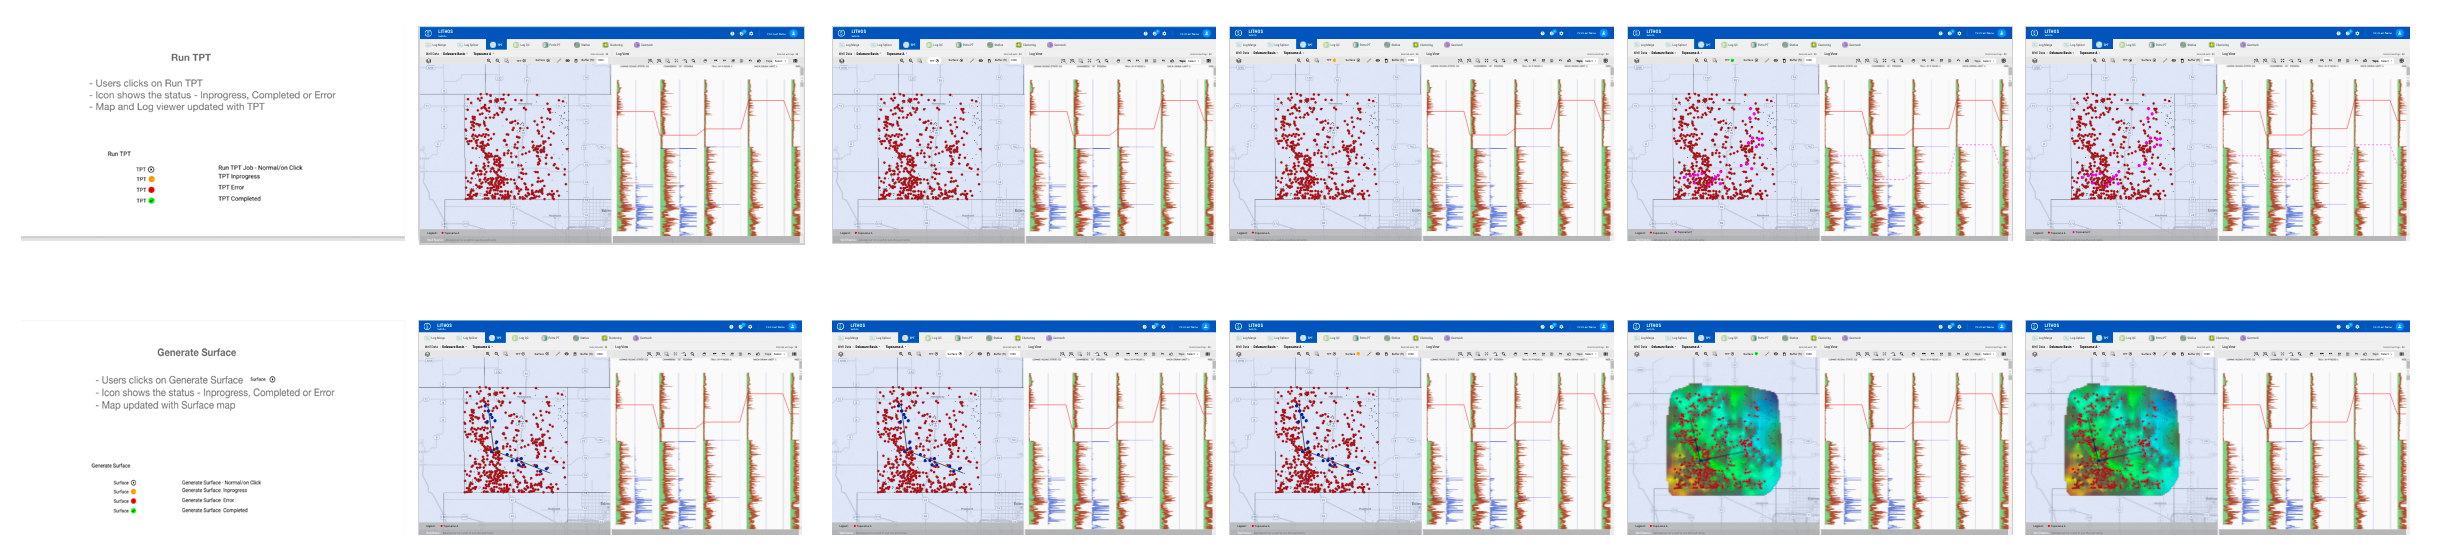
Wireframe Flows - TPT & Generate Surface
Run TPT Interactive Prototype - Video Demo
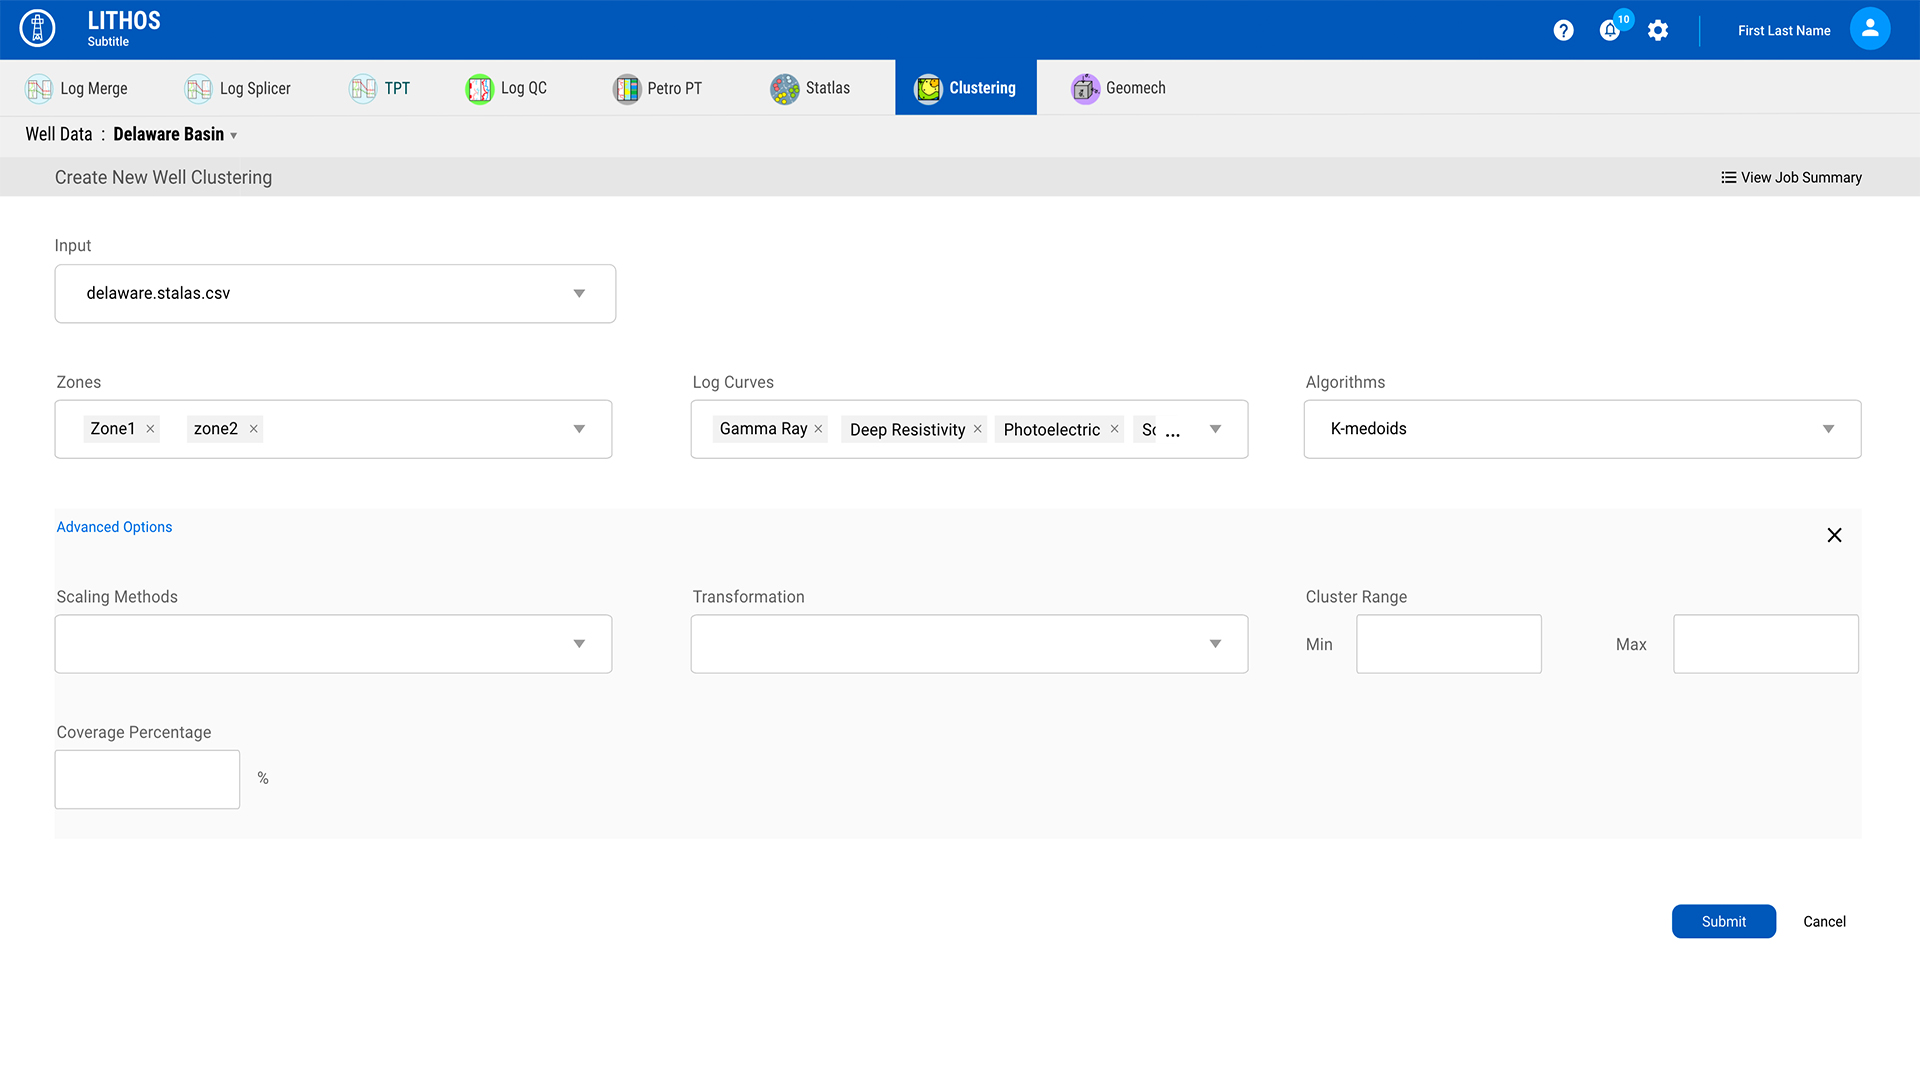
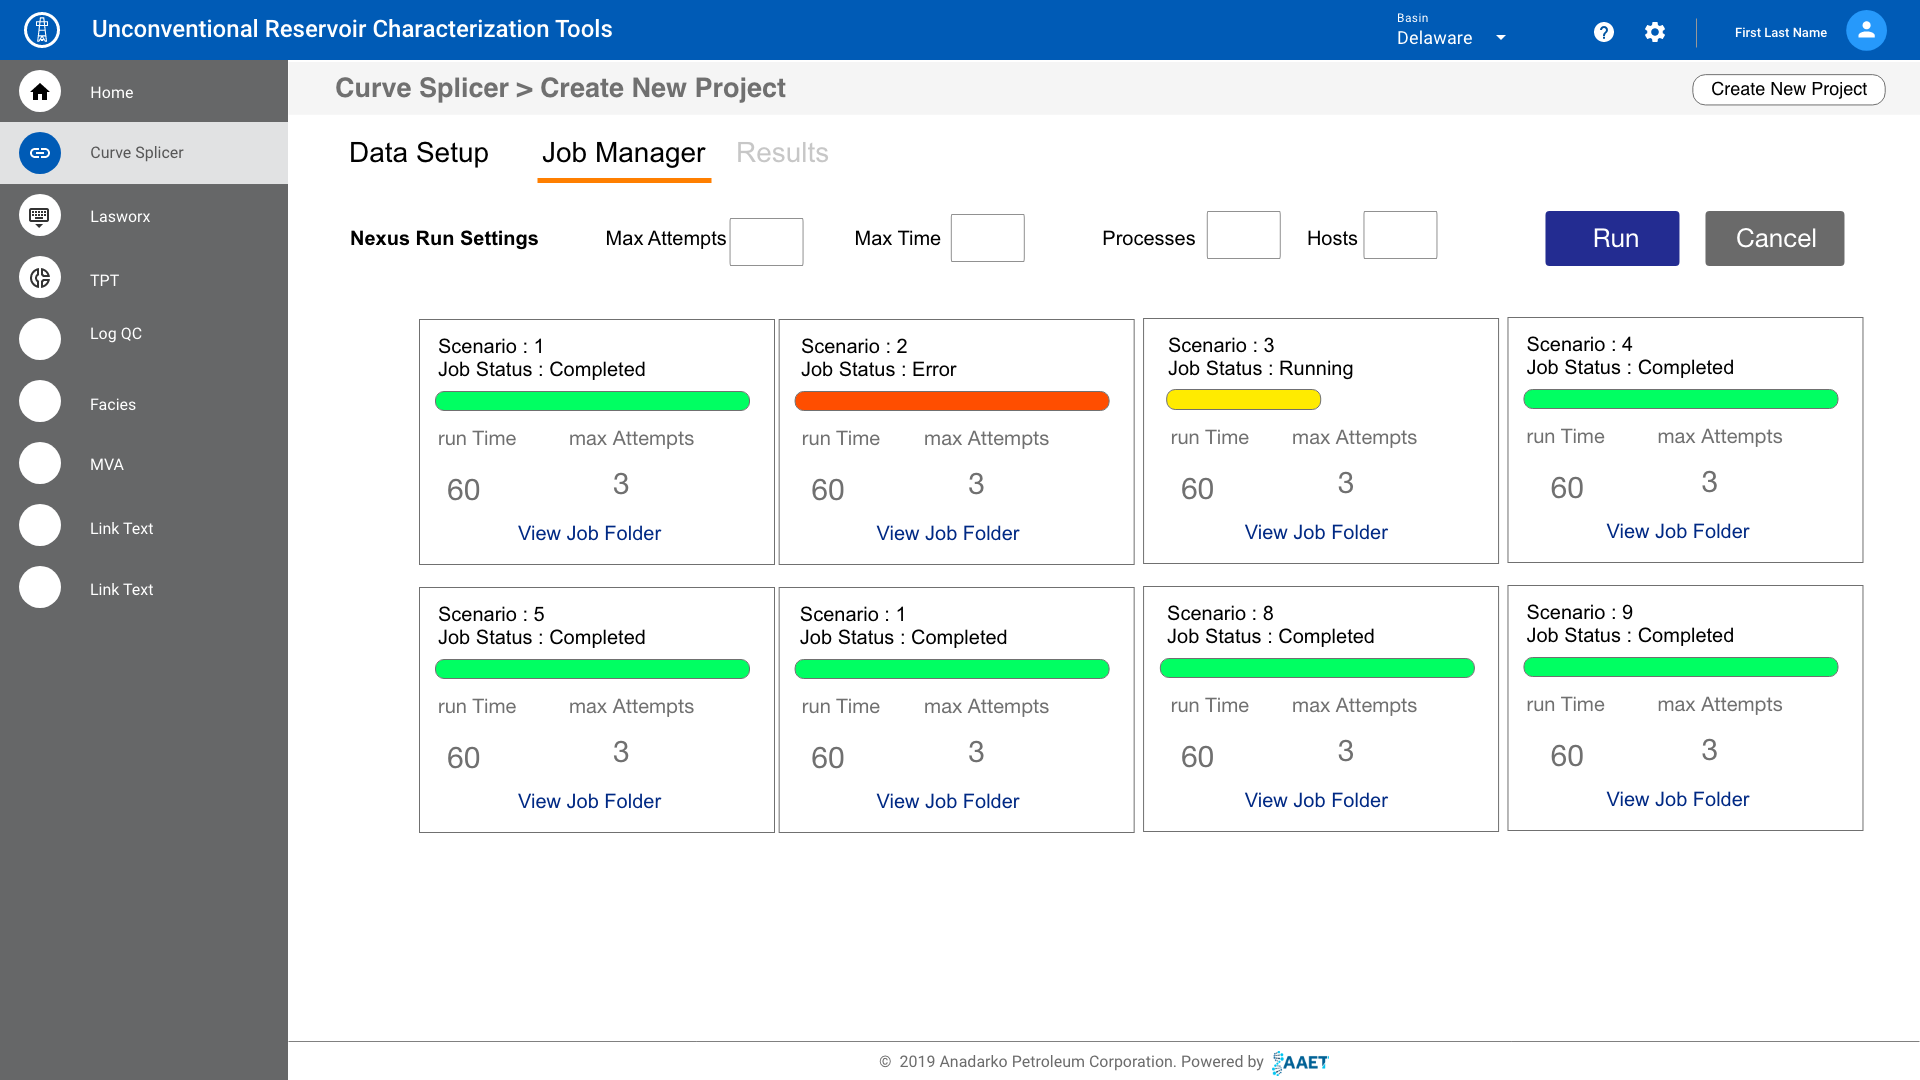
Other sections of the product - wireframe/mockups


Scrum Team - UX Stories
Testing & Product Launch
The final product was launched and put it in the hands of the beta customers, who were eagerly waiting to play around. The feedback was very positive with the requirement of adding a few minor features. We launched the MVP within weeks of final testing.
Developed Product Prototype
Impact
Impact
Reduced Manual Work by Automation of Big Data
Saves time by automation of the log files QC
Reduces human error by 90%
Maps display 100,000 wells & data, Cross Sections display 1000+wells
Easy transfer of data between platforms

Happy Customers & Domain Experts
Made it easy for geologists by the successful delivery of a UX solution for a complex problem to external customers.
One of kind Solution - Good Business
Reduced the manual time which saved the business of $1.2 M.
Tools
Some of the tools I used in this project